This site uses cookies that are essential for our site to work. We would also like to use non-essential cookies to help us improve your browsing experience and help make this website better, by collecting and reporting information on how you use our site.
The pandemic took an enormous toll on many industries, and healthcare was no exception. As hospitals, medical practices, outpatient facilities, and many healthcare organizations limited, paused or postponed services and procedures with the initial global spread of COVID-19, the effect was unprecedented.
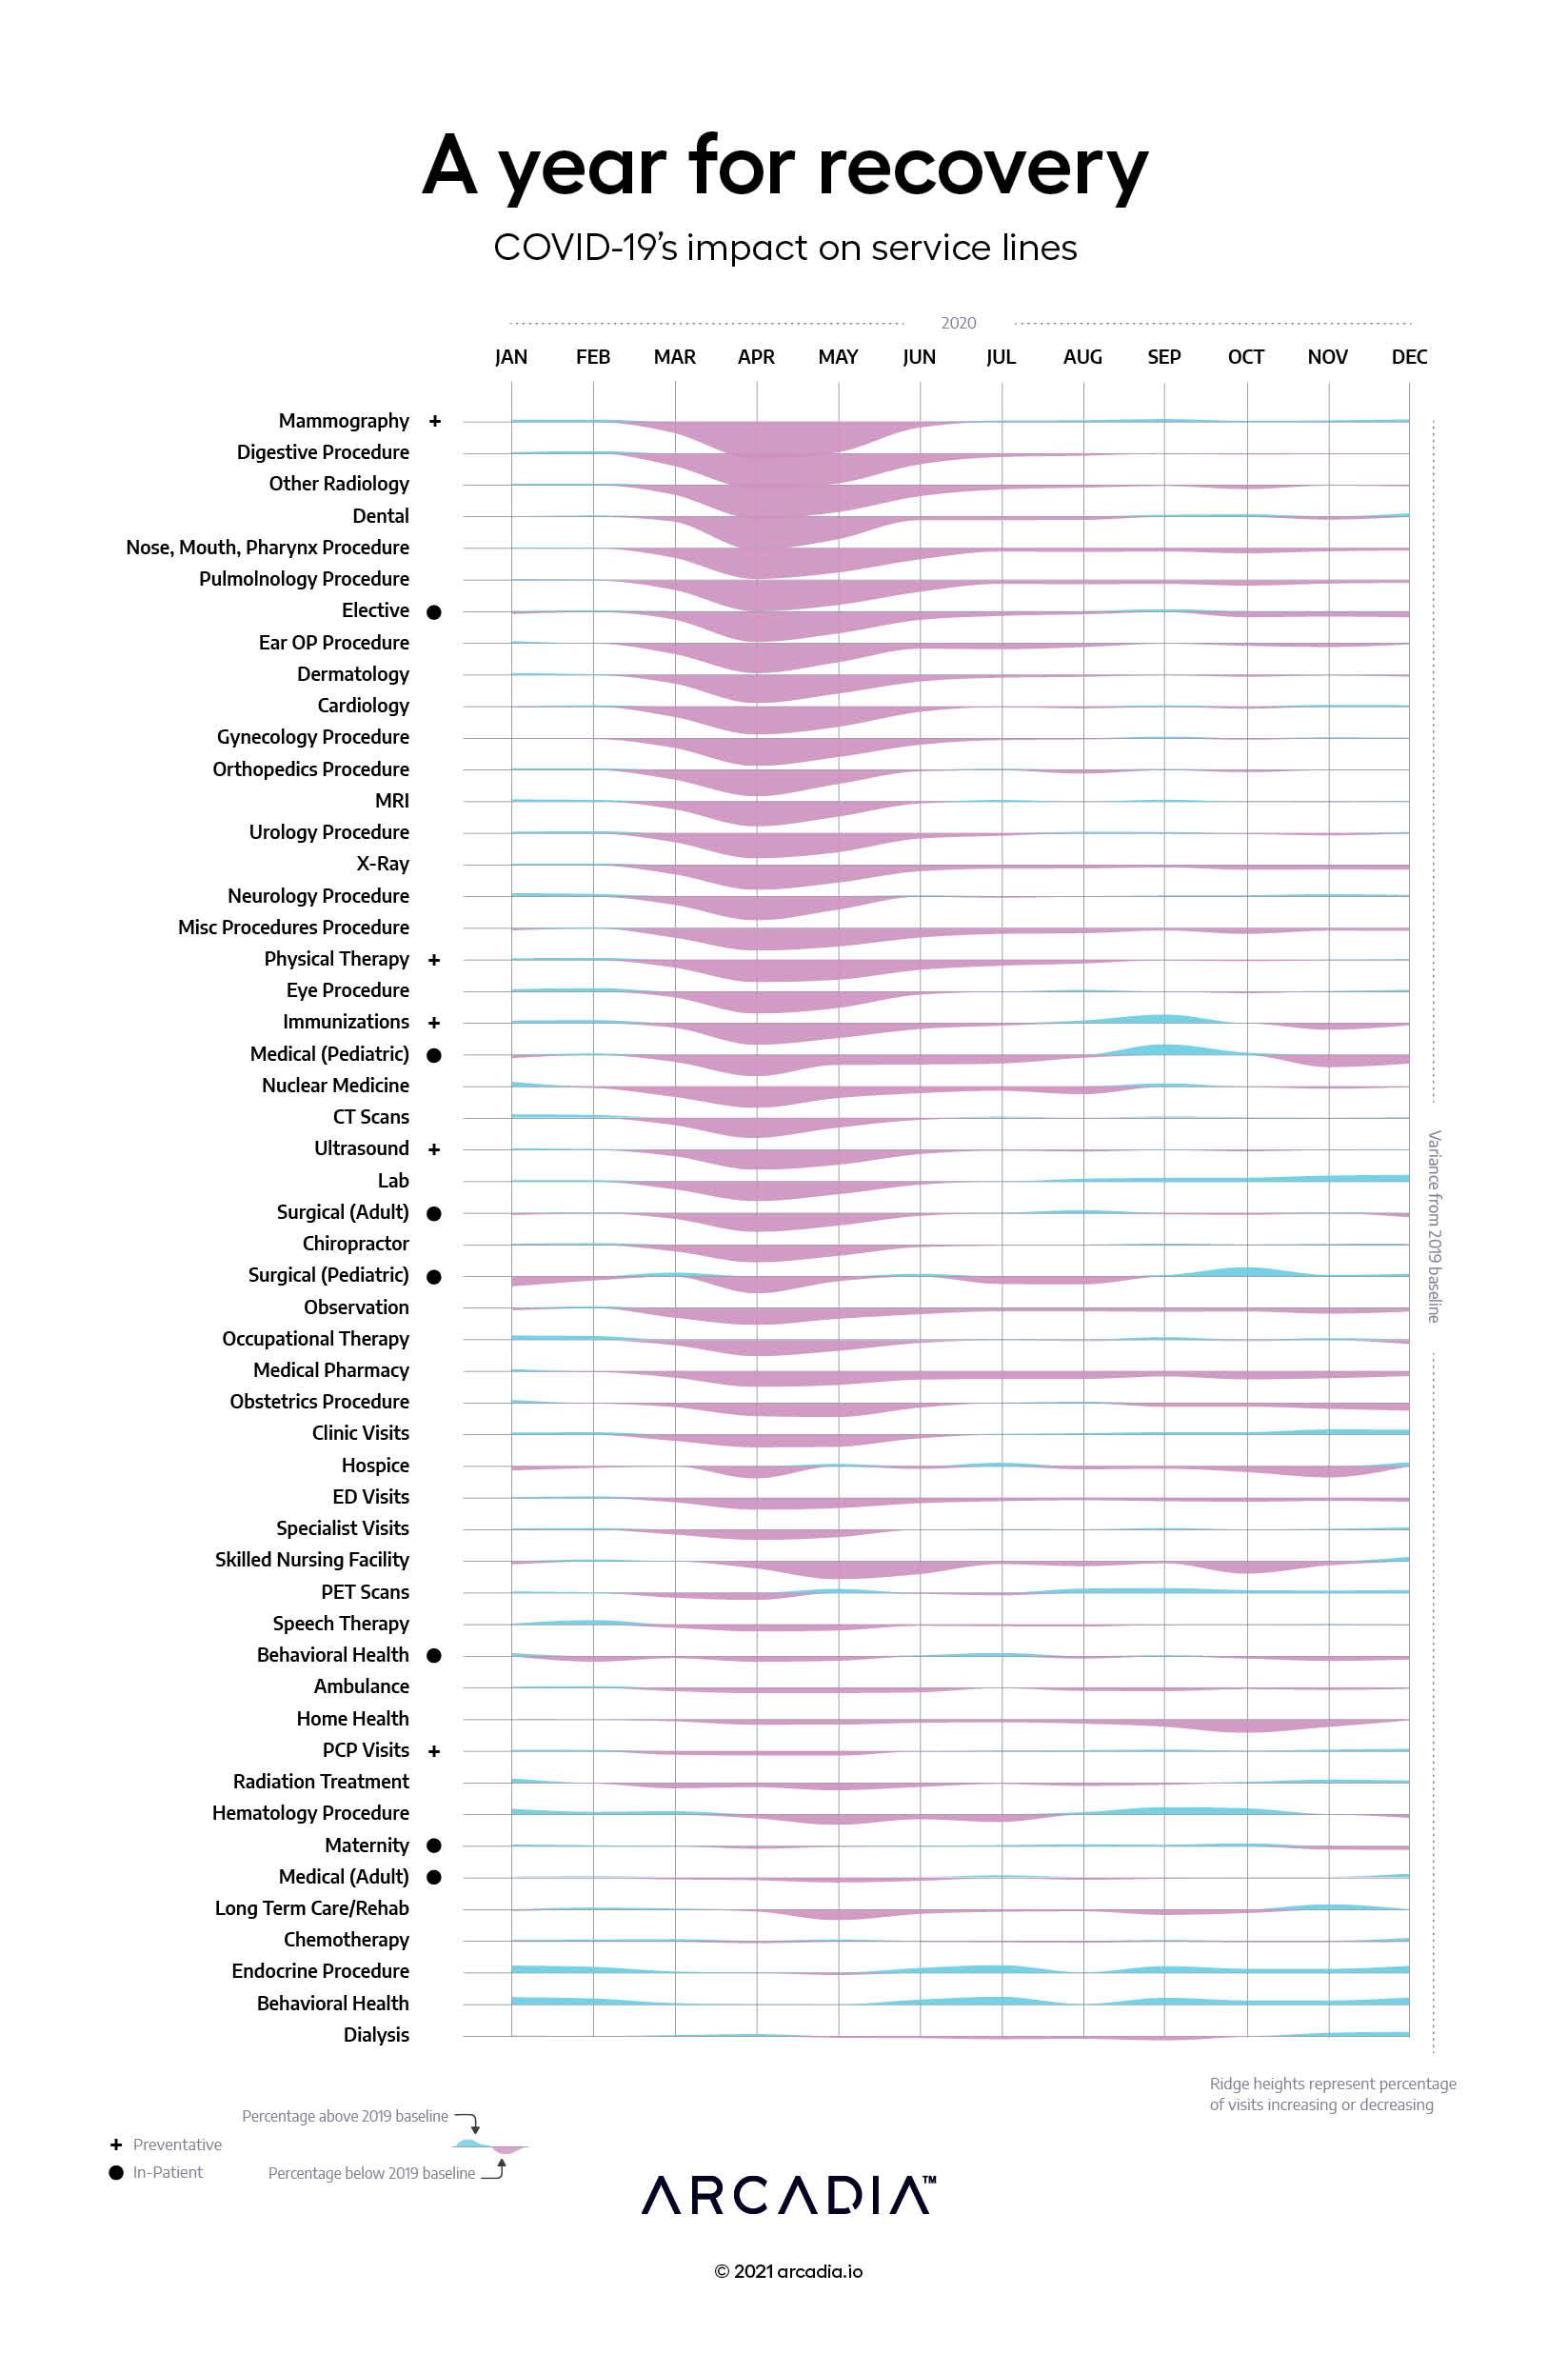
Covid-19 significantly shook up healthcare utilization primarily in March–May of 2020. Nevertheless, the impact was uneven across service lines.
In this data chart, you can see the variation in healthcare utilization from 2020 vs. 2019. Some changes to care delivery seemed to have a longer impact, such as a reduction in imaging services delivered in general. Physical therapy had a longer decline than many other services. There was also a clear shift away from administering drugs in outpatient settings (medical pharmacy reduction).
As we moved into June, the service line impact began a recovery trend. However, like the initial declines, the rebound was also uneven. Some services lines went back to the 2019 baseline, such as orthopedics procedures, MRIs, neurology procedures, CT scans, chiropractors, speech therapy, and several others.
Other services lines seemed to have greater resilience and rebound power. A few service lines — immunizations, pediatrics, lab services, PET scans, hematology, endocrine procedures and behavior health — saw increases above the 2019 baseline. However, some of those same buoyant healthcare offerings retreated below the baseline as the pandemic surged at year’s end.
Details
D3.js, Excel, and Illustrator Data sourced from Commercial, Medicare and Medicaid claims
This article covers insights from Episode 1 of the series, which features industry leaders Michael Meucci, CEO of Arcadia, and Albert Marinez, Chief Analytics Officer at Cleveland...
This article presents five practical strategies to improve patient care and team productivity by delivering the right information at the right time at the point of care. It covers...
Arcadia’s Chief Product and Technology Officer, Nick Stepro, was recently named one of Modern Healthcare’s 2024 Innovators. The program recognizes leaders driving innovation that...