Referral networks: Looking for optimization opportunities

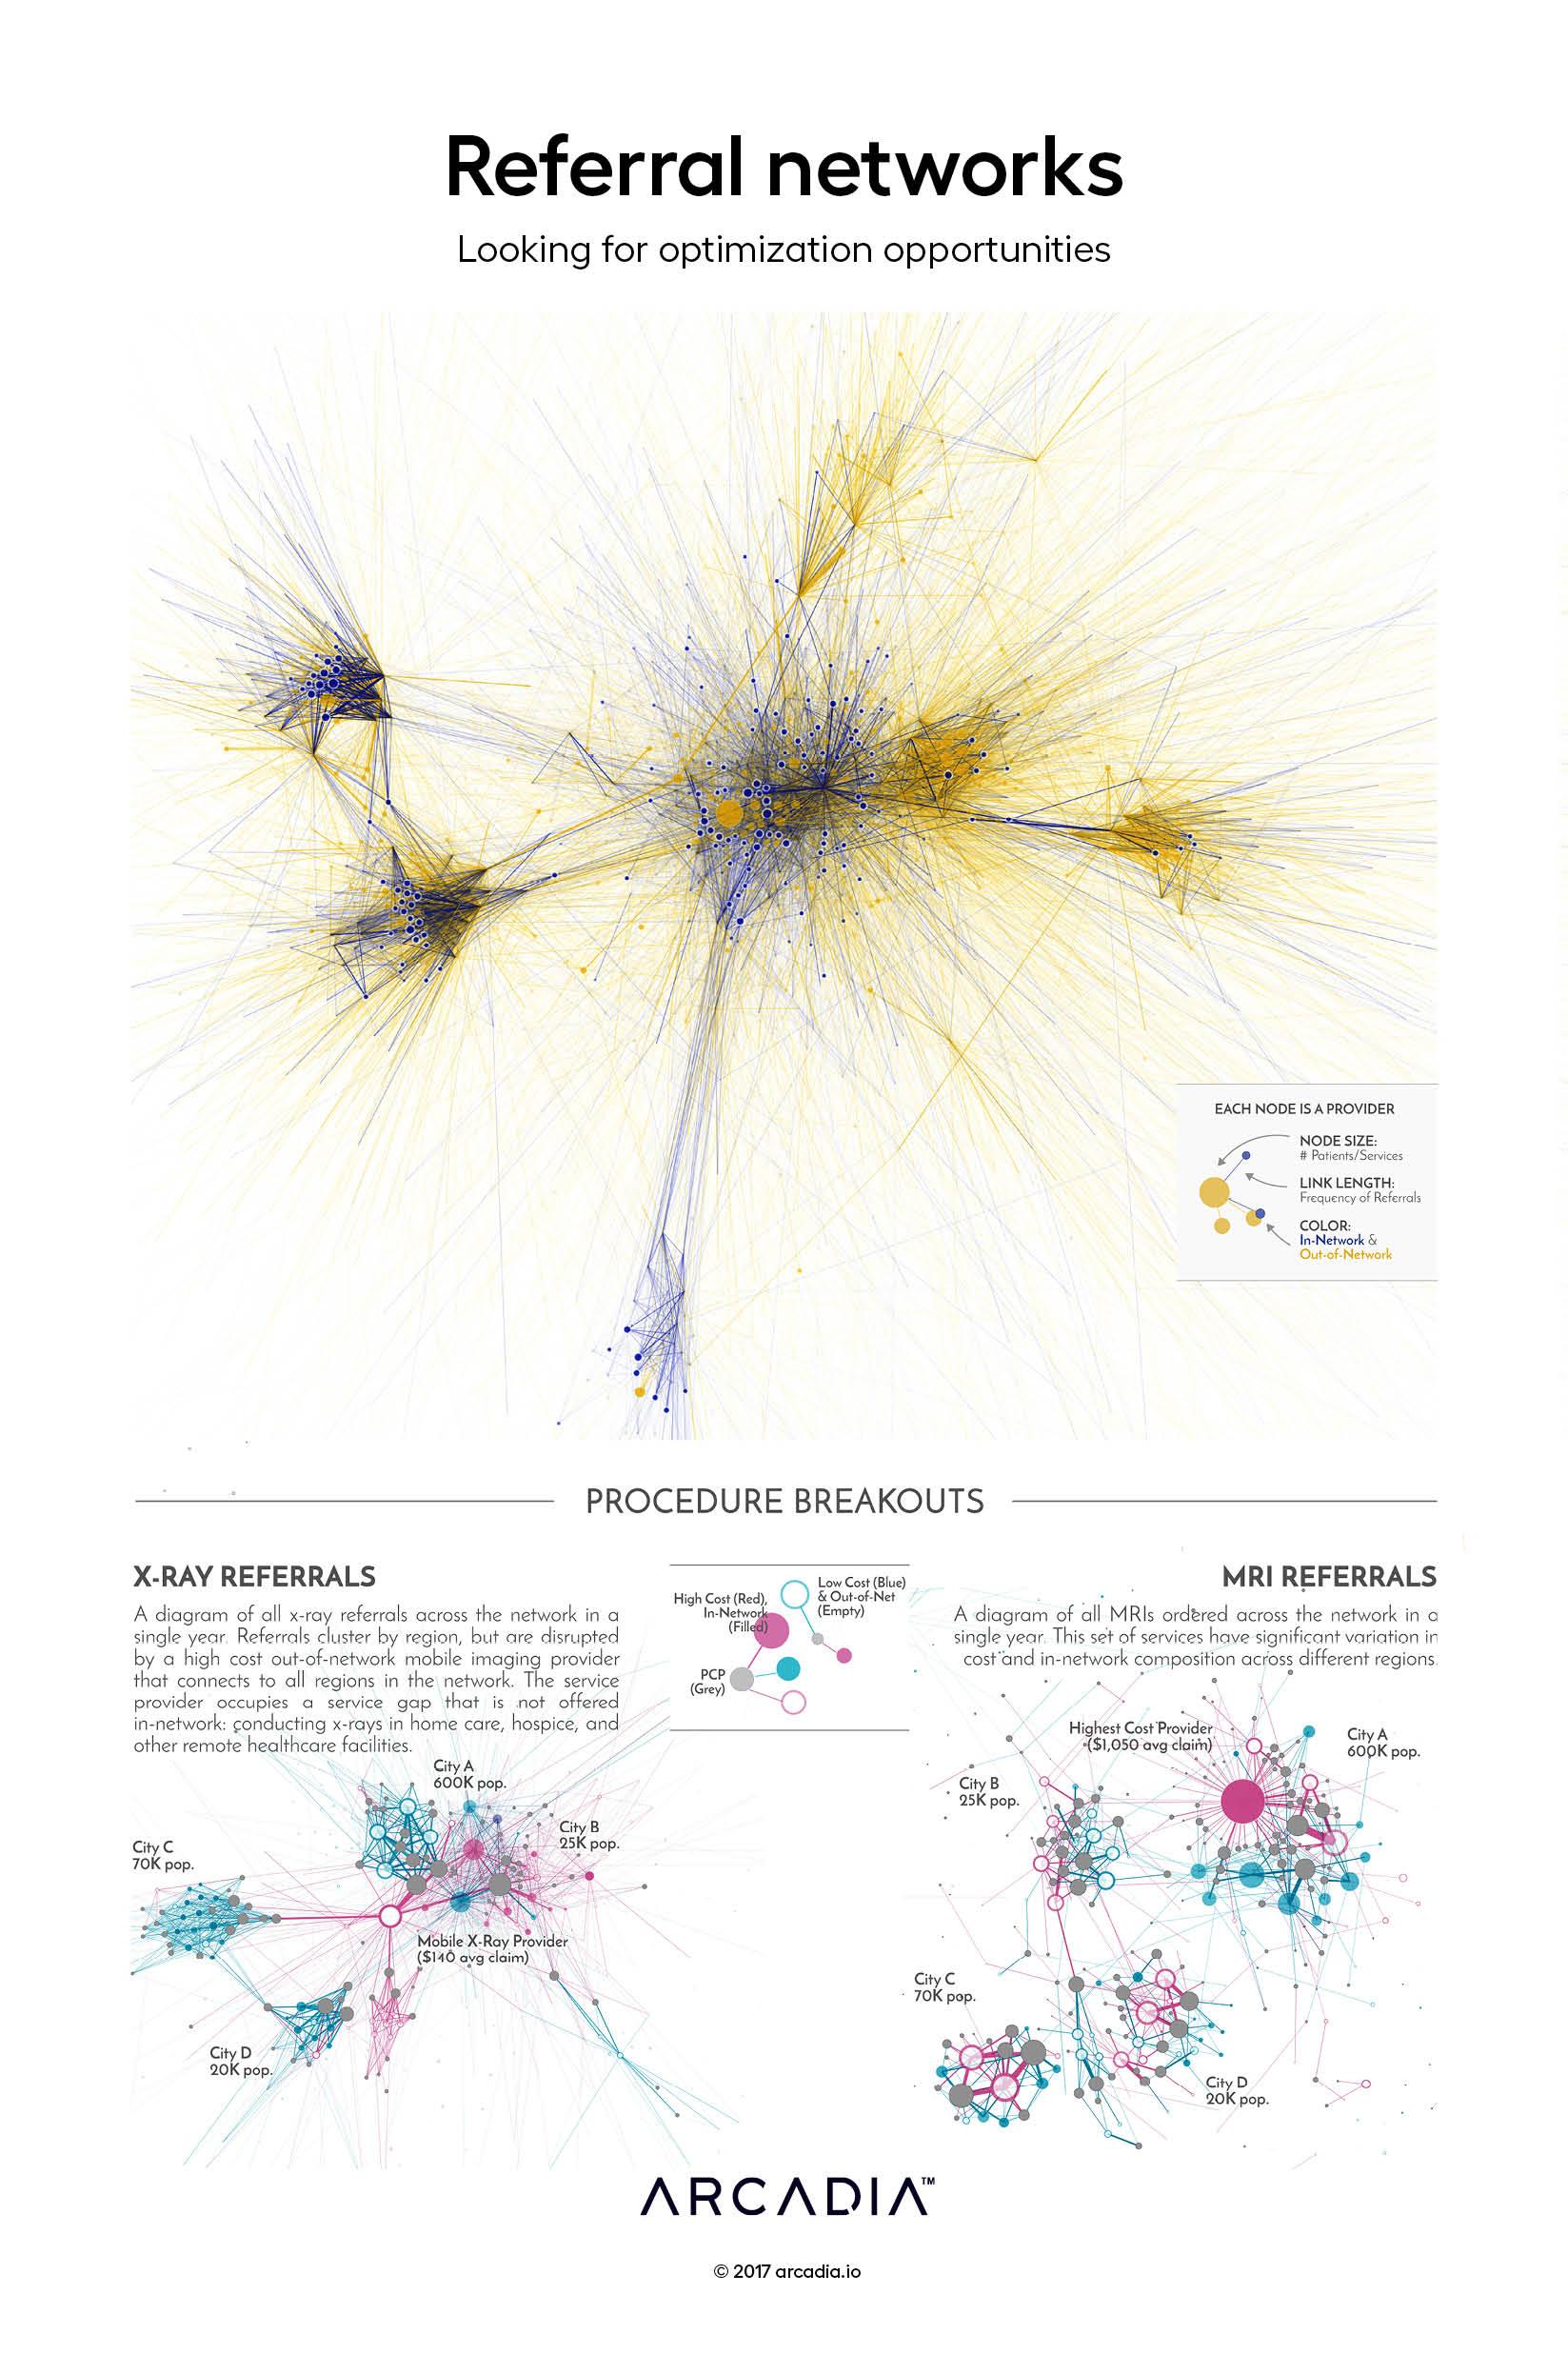
Referral networks are built on complex patterns of decision making. Several factors feed into a referral — convenience, procedure quality, personal relationships, and others. Over time, these behaviors and inclinations cluster into patterns. Routes start to develop, and opportunities to optimize emerge.
To make sense of a large referral network, the artist started from the ground-up: by using a physical simulation to visualize each referral between a PCP and servicing provider. In the top figure, every referral (taken over a one-year period) is visualized as a line. Providers, represented as nodes, are pulled into their final positions based on the aggregate strength of all their referral relationships. Patterns in procedure referrals are readily visible, with streaks of out-of-network leakage coloring the graph.
At a smaller-scale, this approach to visualizing referral patterns can identify optimization opportunities. Through the x-ray breakout, the artist shares an example of an out of network servicing provider that occupies a market gap not yet covered by the network. To the right, the artist presents a network that is brimming with opportunities for re-routing. In this figure, primary care providers can be quickly identified that have strong connections to out-of-network and high cost services.
Details
SQL, D3.js SVG, with Illustrator
Data sourced from Arcadia Benchmark Database with multiple EHR and Claims datasets
