This site uses cookies that are essential for our site to work. We would also like to use non-essential cookies to help us improve your browsing experience and help make this website better, by collecting and reporting information on how you use our site.
The risk of a patient is used as proxy for expected patient cost, and thus drives provider reimbursement in most value-based contractual arrangements. Every year the risk profiles of your patient population reset to zero, and must be rebuilt through appropriately documented diagnoses included in the claims data sent to health plans.
By combining claims data with electronic health record (EHR) data, a provider gets clear insight into what patient risk has been appropriately documented in the year and target any gaps.
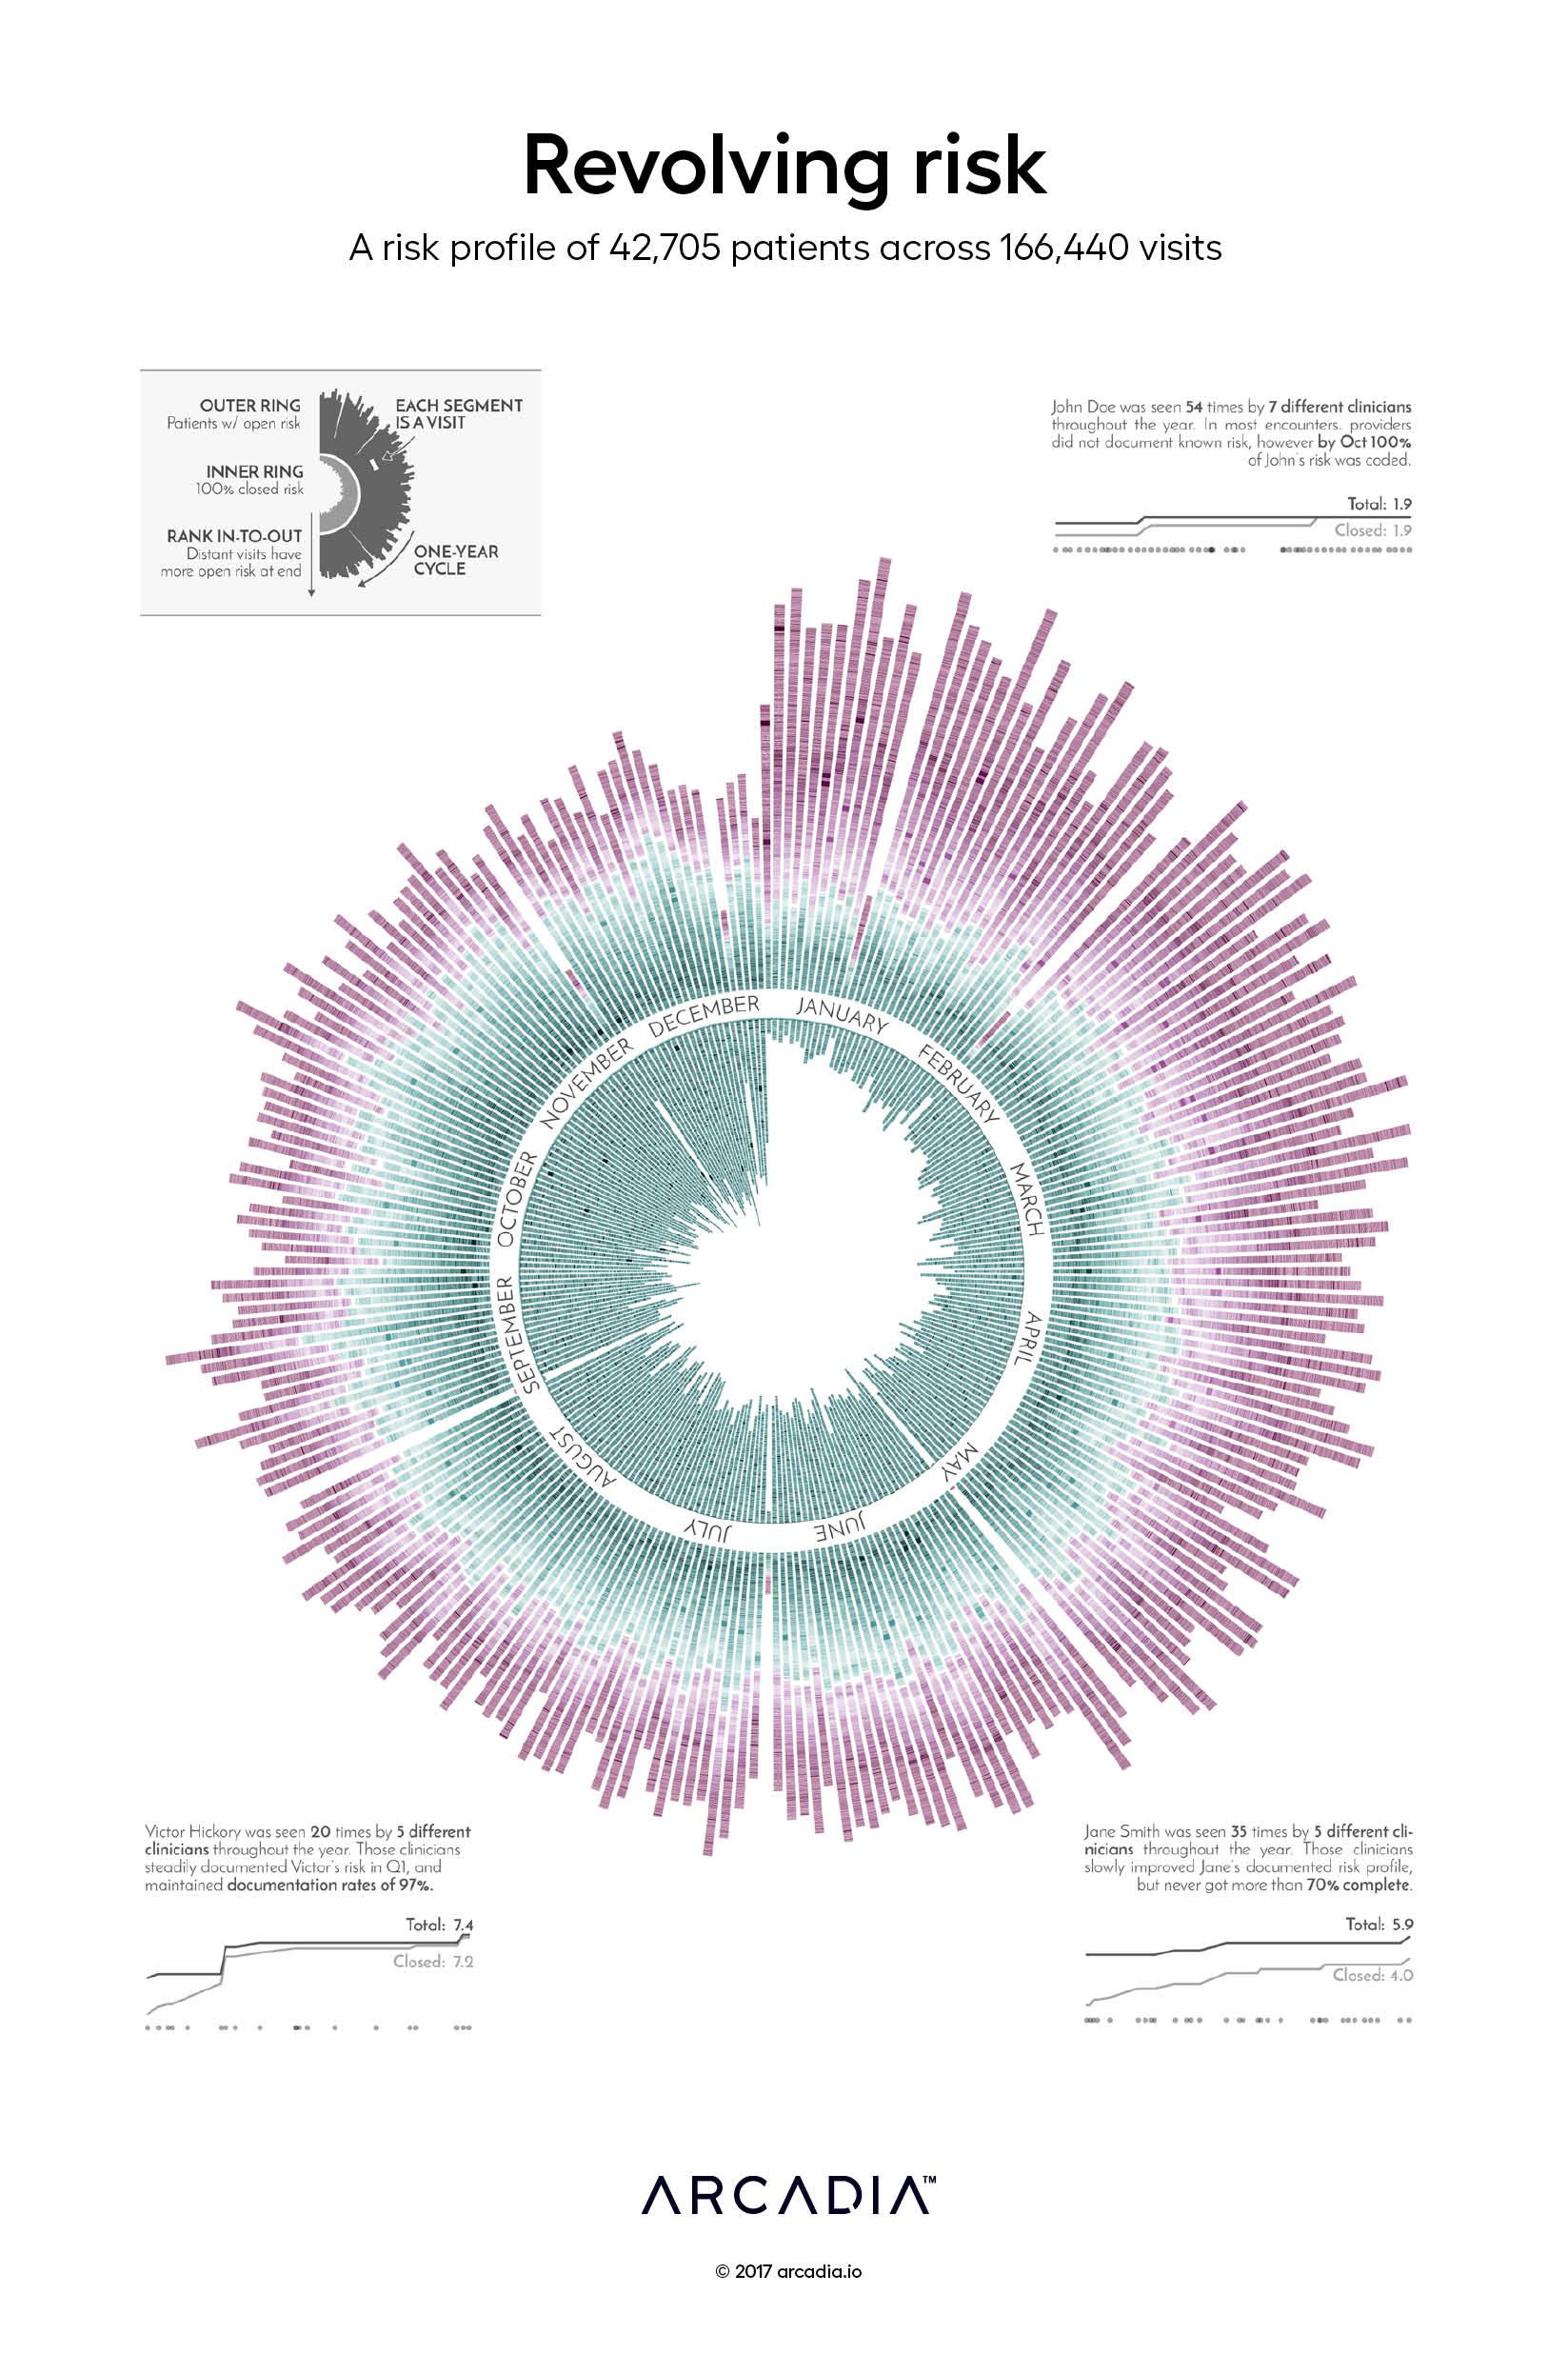
The artists choose to represent what can feel like a revolving process, repeatedly chasing the potential risk of the patient, through a circular visualization of a calendar year. The opportunity for full risk closure in a given day is structured in the figure as a stacked bar where each blip is a visit between the patient and their provider. A visit that results in the fully documented risk profile is captured in the inner circle, while the distance from the center ring and color of the blip represent the amount of undocumented risk associated with that patient during that visit.
Through the sample patient call outs, the viewer can experience how, for providers trying to fully document patient risk in a given visit or throughout the year, the struggle is real.
Authors
Omar Nema Michael Gleeson
Details
SQL, Excel, D3.js SVG, with Illustrator Data sourced from Arcadia Benchmark Database with multiple EHR and Claims datasets
Arcadia, a leading healthcare data platform, and Nordic Capital, a premier private equity investor in healthcare and technology, today announced a strategic partnership where Nordic...
Join us October 14 – 16, 2025 in Las Vegas at our annual conference to network and learn techniques to accelerate performance through data and analytics.
LAS VEGAS, NV – June, 16, 2025 – Quest Analytics, the leader in provider network design and management solutions, announced today a strategic data integration partnership with Arcadia,...