This site uses cookies that are essential for our site to work. We would also like to use non-essential cookies to help us improve your browsing experience and help make this website better, by collecting and reporting information on how you use our site.
The evolution of diabetes: 12 years of disease state transitions
By
Abhi Kumbara, Technical Lead at Arcadia, Michael A. Simon, PhD, Director of Data Science at Arcadia, and Amy Werner-Allen, Senior Technical Data Analyst at Arcadia
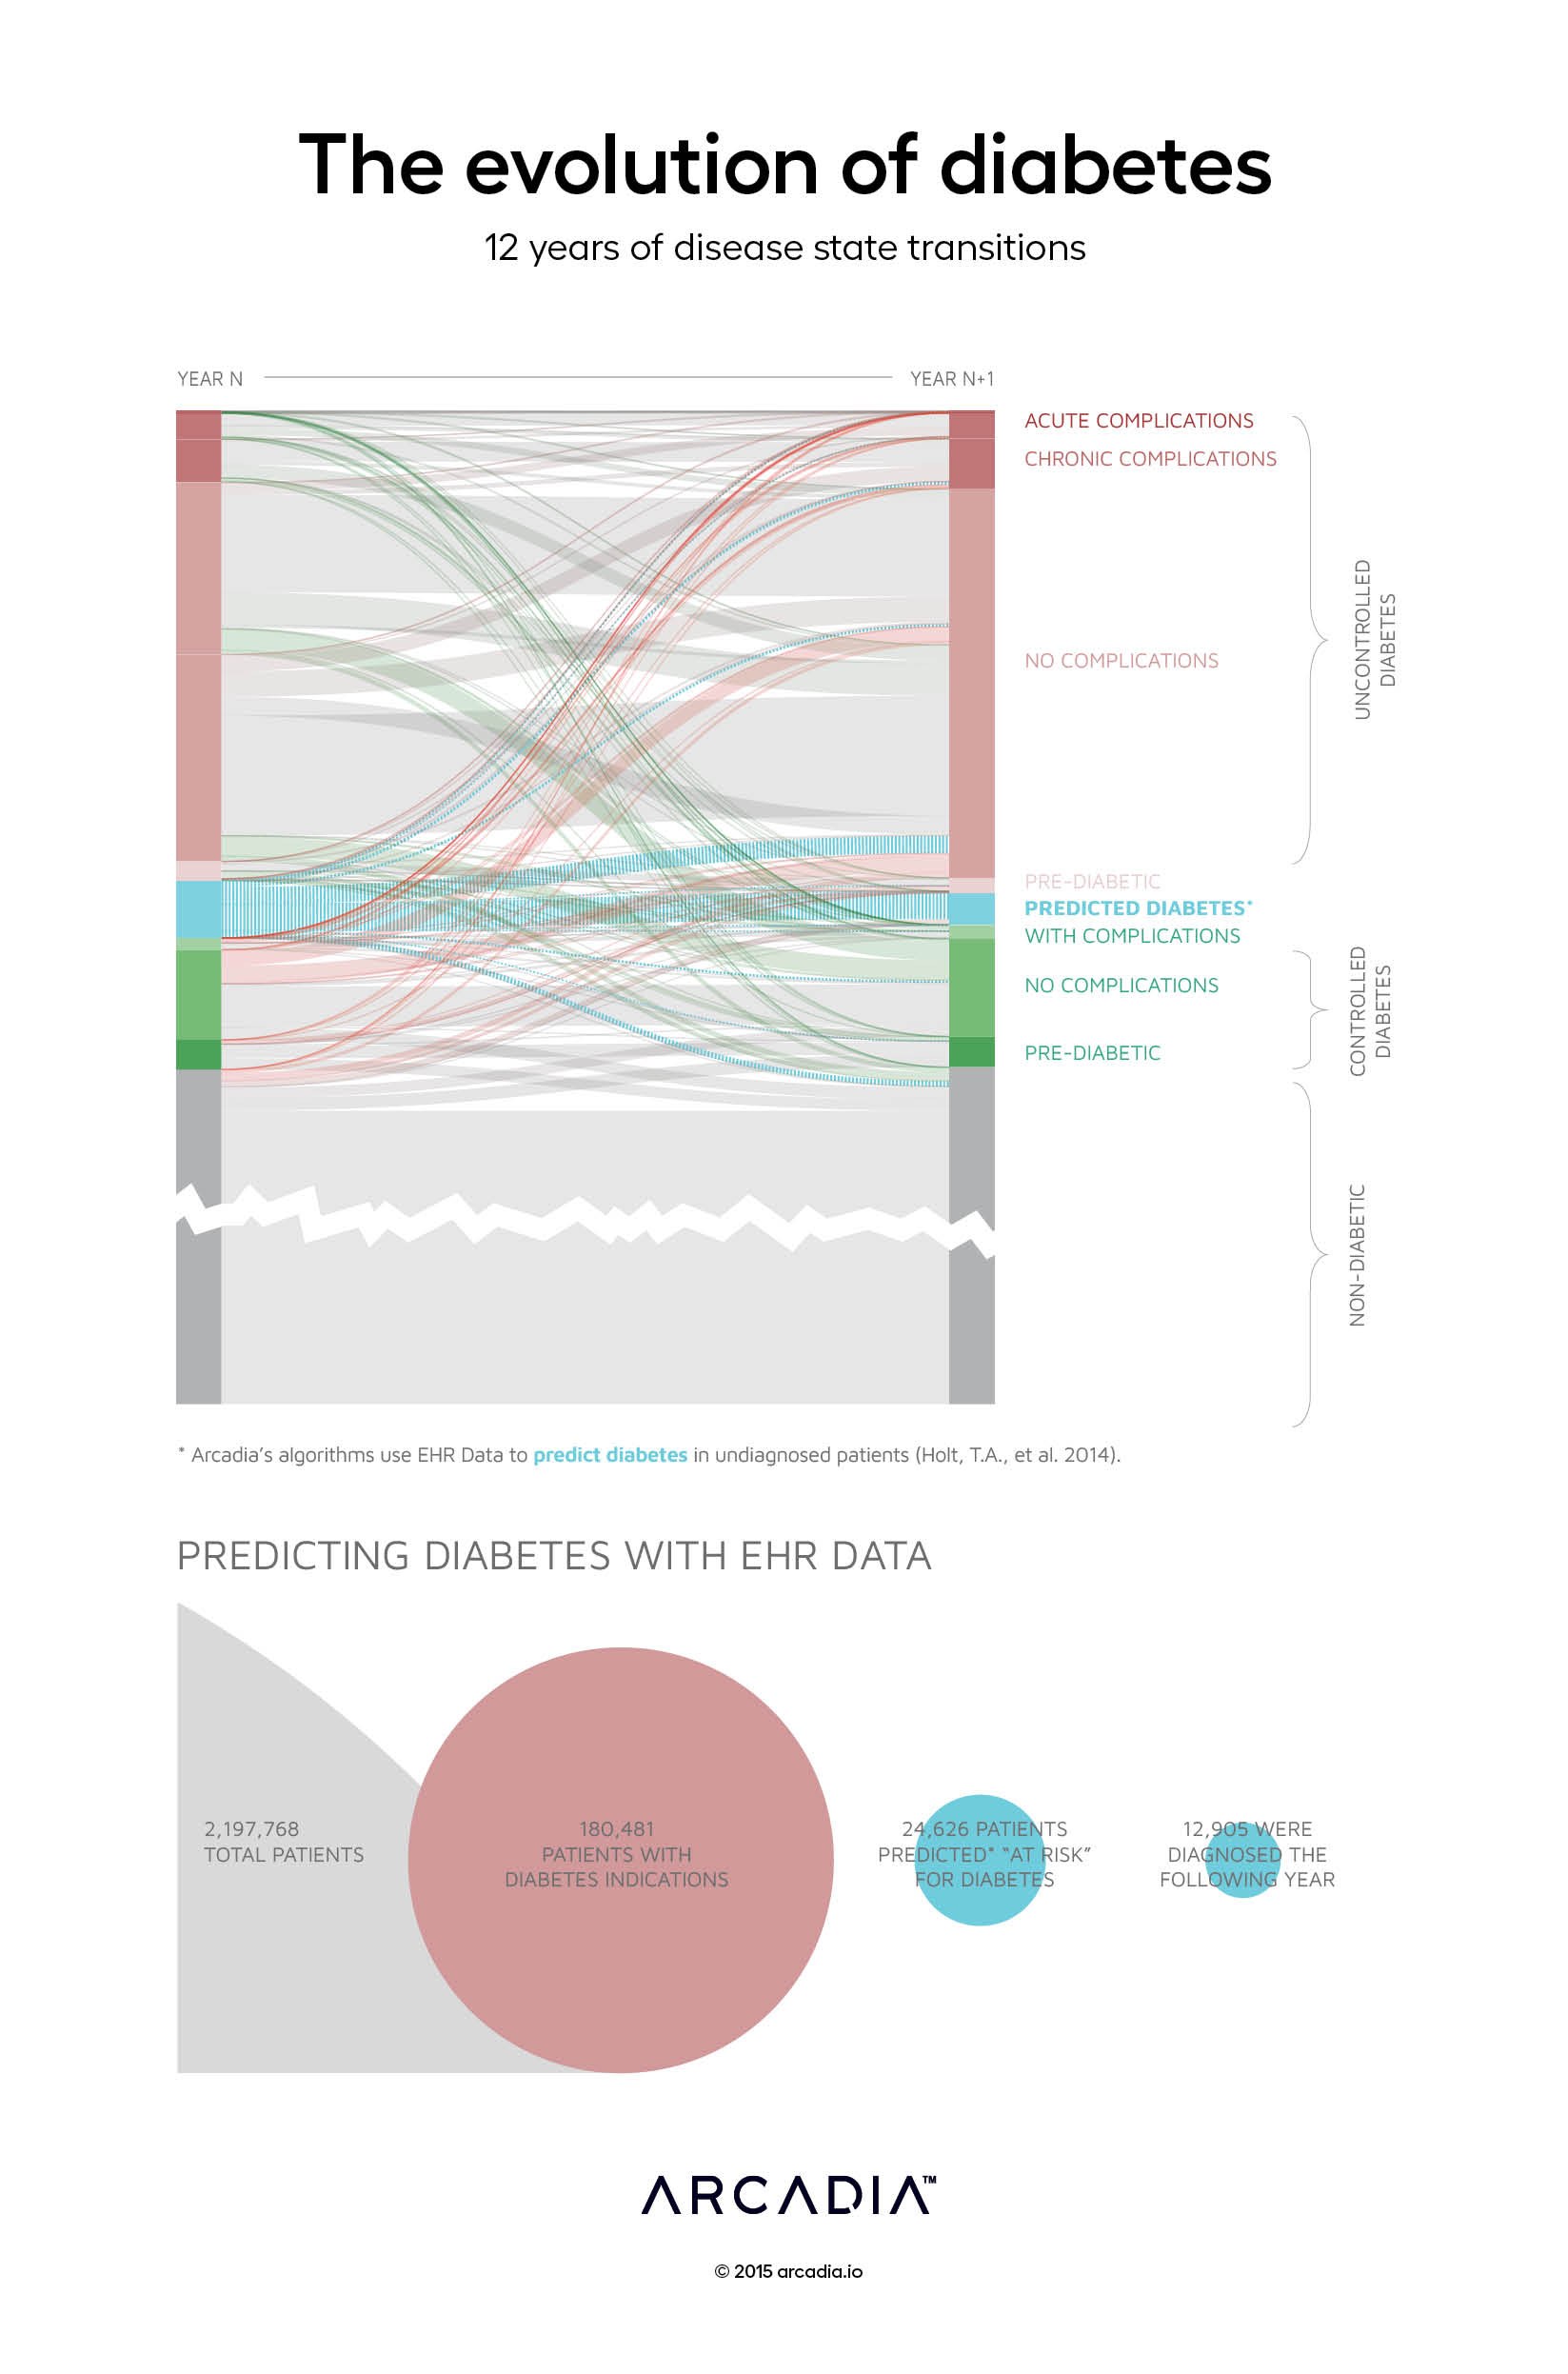
With a de-identified dataset of Claims and EHR records for nearly 10 million lives, Arcadia’s Benchmark Database provides nearly limitless possibilities for advanced population studies. Here, over a decade of diabetic patient data are normalized to visualize transitions between various states of severity and control of the condition. Rising red lines represent patients who are initially diagnosed with diabetes or whose diagnosis increases in complexity, as defined by lab and assessment data from the EHR. Swooping green lines show patients going in the opposite direction, moving into a position of better condition management. The reasons behind these transitions vary – among them, medication adherence, complicating conditions and unplanned (or well-managed) social, psychological or economic interactions.
In this longitudinal study, Arcadia implemented a predictive algorithm (see Holt, T.A., et al, 2014) that leverages a variety of lab result data to identify undiagnosed diabetics, a group that the CDC estimates represents over 25% of all diabetics, nationally. The algorithm identified a group of patients, over 13% the size of the known diabetic population, at a high likelihood of being diagnosed with diabetes in subsequent years. 45% of those patients were diagnosed the following year. The vast majority were uncontrolled at the end of that year. Nationally, the incidence of new cases of diabetes was 7.8 per 1,000 individuals in 2012, meaning the predicted group had an incidence rate over 50 times that of the general population. With Arcadia, providers and care managers can use algorithms like this to trigger early outreach and education, increasing disease control rates well before the initial diagnosis.
Arcadia, a leading healthcare data platform, and Nordic Capital, a premier private equity investor in healthcare and technology, today announced a strategic partnership where Nordic...
Join us October 14 – 16, 2025 in Las Vegas at our annual conference to network and learn techniques to accelerate performance through data and analytics.
LAS VEGAS, NV – June, 16, 2025 – Quest Analytics, the leader in provider network design and management solutions, announced today a strategic data integration partnership with Arcadia,...