This site uses cookies that are essential for our site to work. We would also like to use non-essential cookies to help us improve your browsing experience and help make this website better, by collecting and reporting information on how you use our site.
Data, data, everywhere — but how to make sense of it all? In a playful new interactive data visualization, we look at the challenges of finding meaning among the correlations.
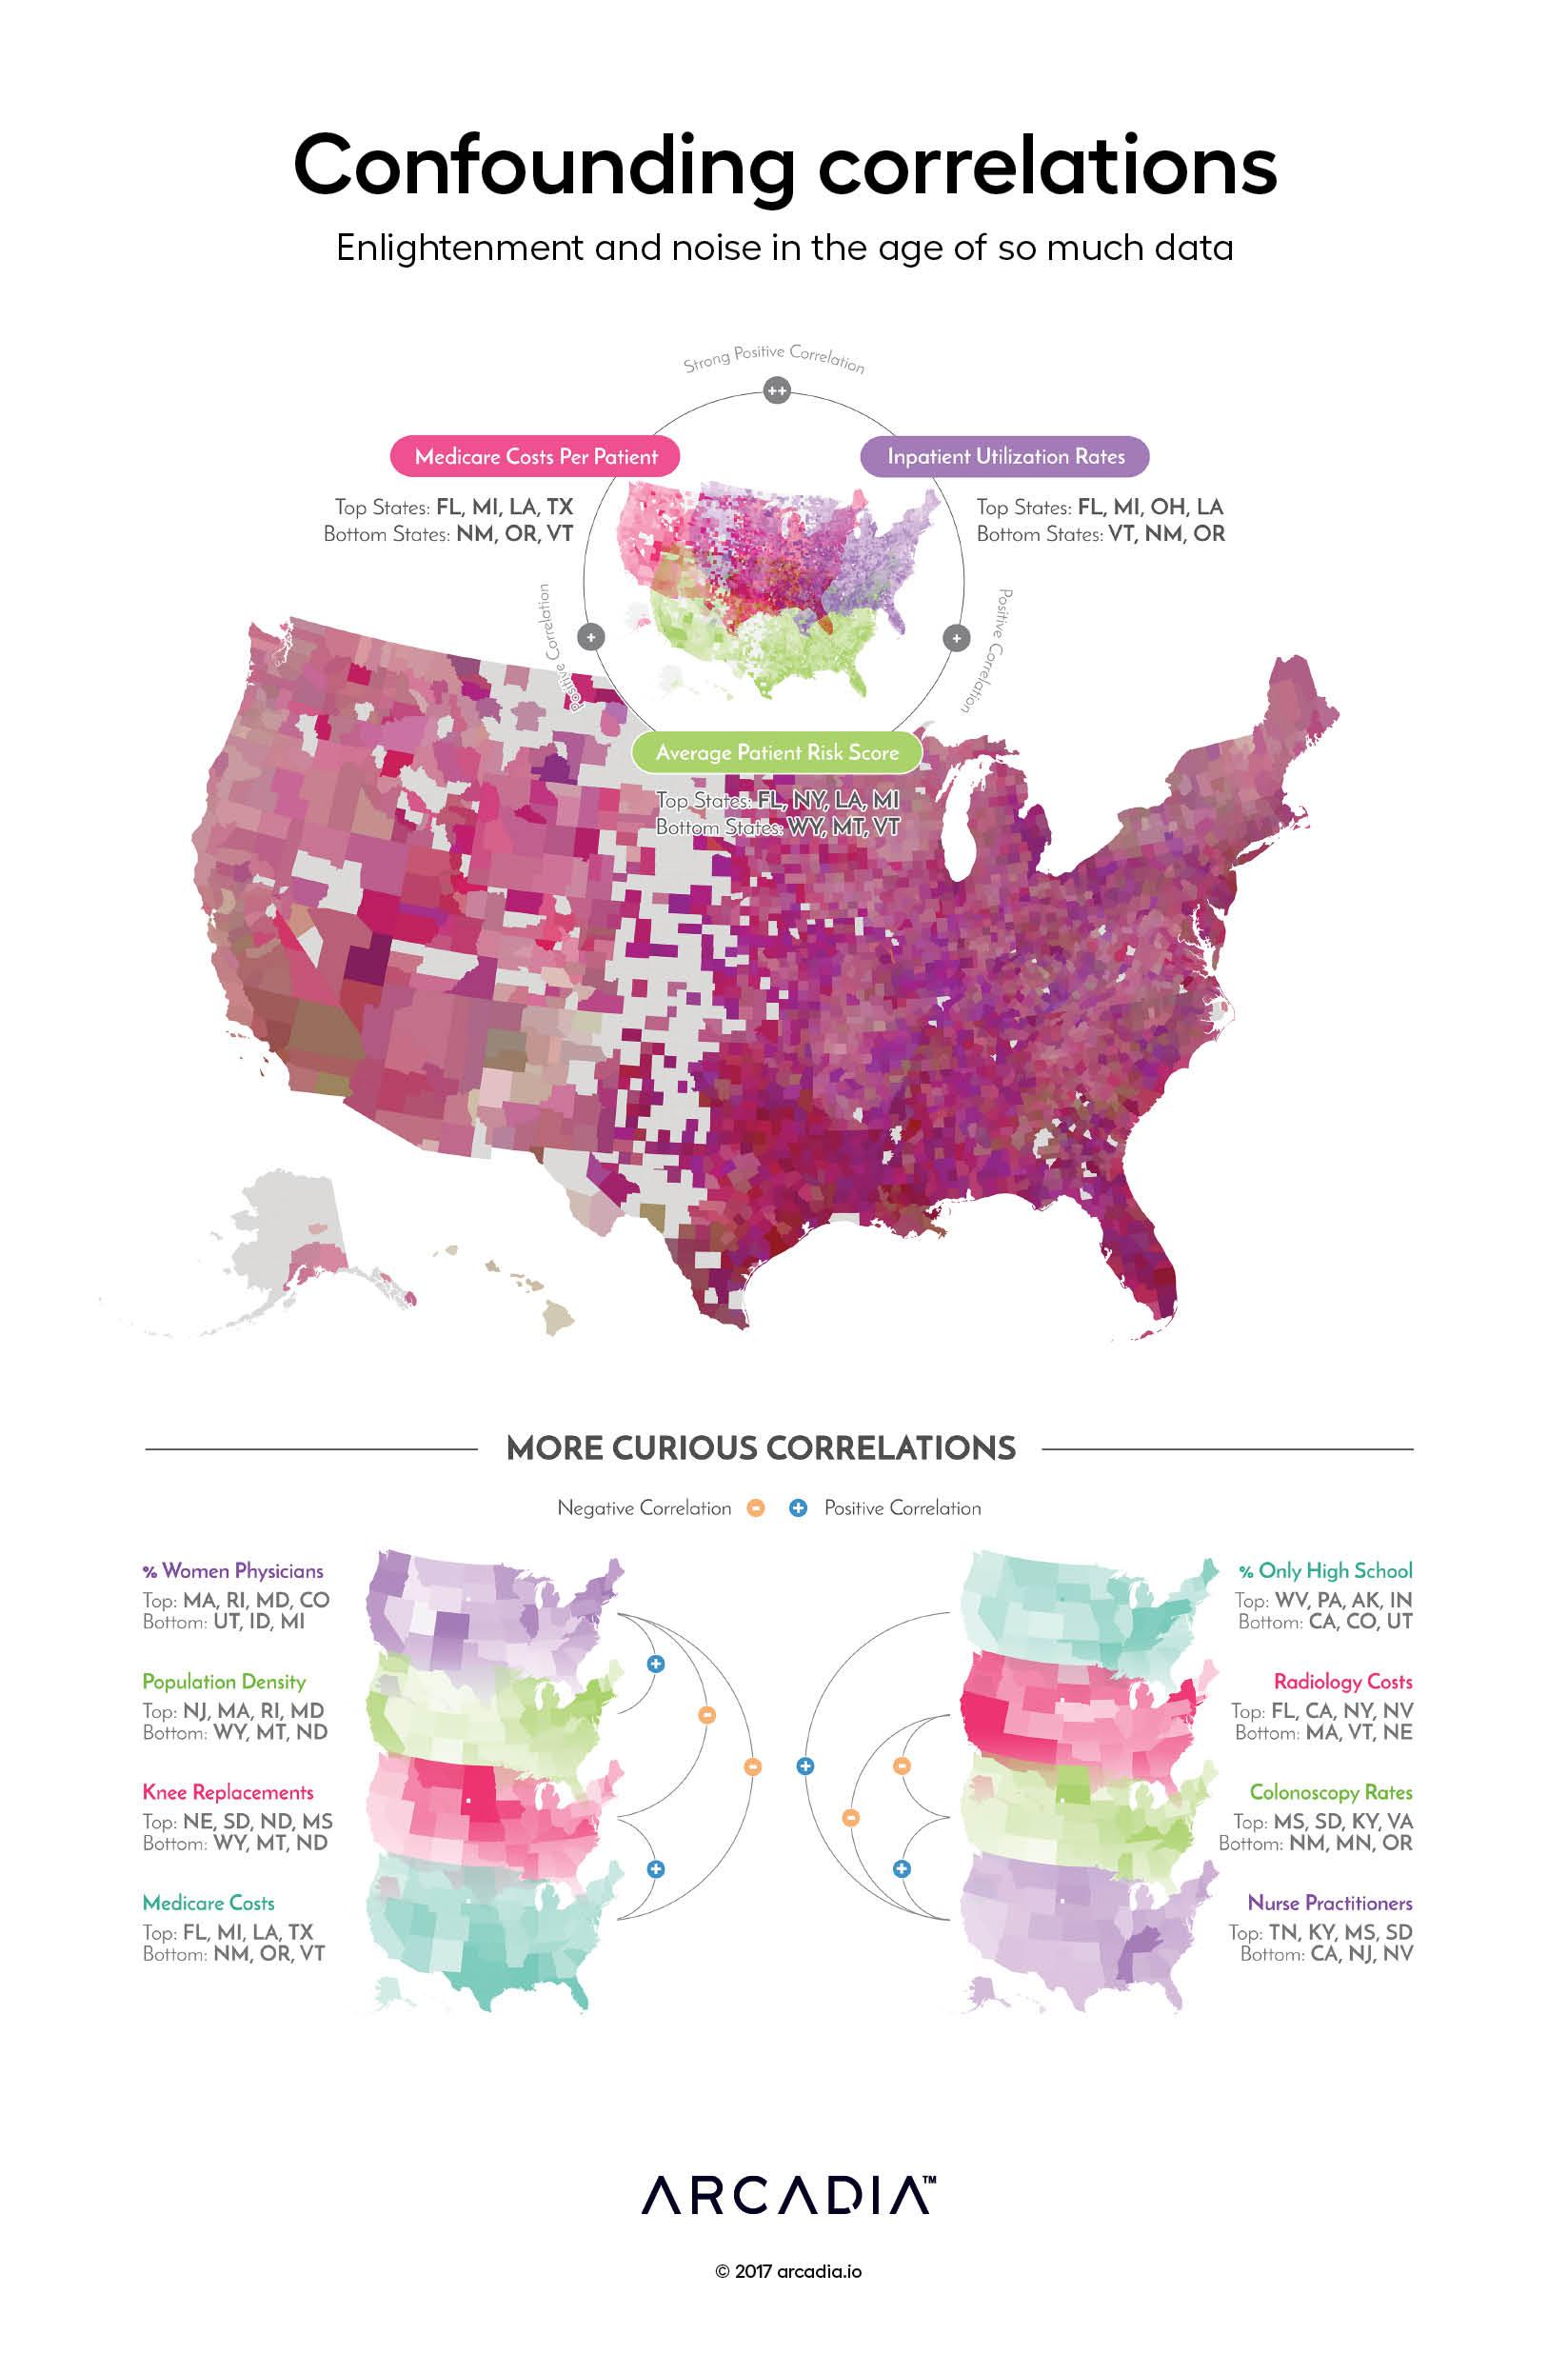
In an age of expanding data and increasingly powerful tools to process and visualize it, it’s increasingly difficult to filter out the noise and find meaning in a sea of numbers. With this piece, Arcadia vice president of product development Nick Stepro has fun with this concept by running over 1,000 combinations of metrics through a correlation matrix. The links he visualizes are both obvious and completely unexpected.
Of the obvious findings — risk scores, healthcare expenditures and inpatient utilization are all positively correlated (though costs and inpatient utilization are most strongly correlated). Less obvious — counties with a higher rate of women physicians are more densely populated, and have a lower per-capita Medicare spend and fewer knee replacements per 1,000. Nurse practitioners are more common in states with less college attendance, and are also associated to higher rates of colonoscopies.
Details
D3.js SVG, with Illustrator Data from CMS Public Use File, US Census American Community Survey, and CMS NPPES NPI Registry
Arcadia, a leading healthcare data platform, and Nordic Capital, a premier private equity investor in healthcare and technology, today announced a strategic partnership where Nordic...
Join us October 14 – 16, 2025 in Las Vegas at our annual conference to network and learn techniques to accelerate performance through data and analytics.
LAS VEGAS, NV – June, 16, 2025 – Quest Analytics, the leader in provider network design and management solutions, announced today a strategic data integration partnership with Arcadia,...