This site uses cookies that are essential for our site to work. We would also like to use non-essential cookies to help us improve your browsing experience and help make this website better, by collecting and reporting information on how you use our site.
Visits to the Emergency Department are portrayed as the trigger for high-cost health care episodes, with so-called “frequent flyers”, who make habitual use of the ED for primary care services, driving up costs for the entire population. Historically, ED utilization remained disconnected from, and often opaque to, the ambulatory care system, but continued investments in statewide HIEs have offered stakeholders in healthcare systems the opportunity to better capture causes of ED visits.
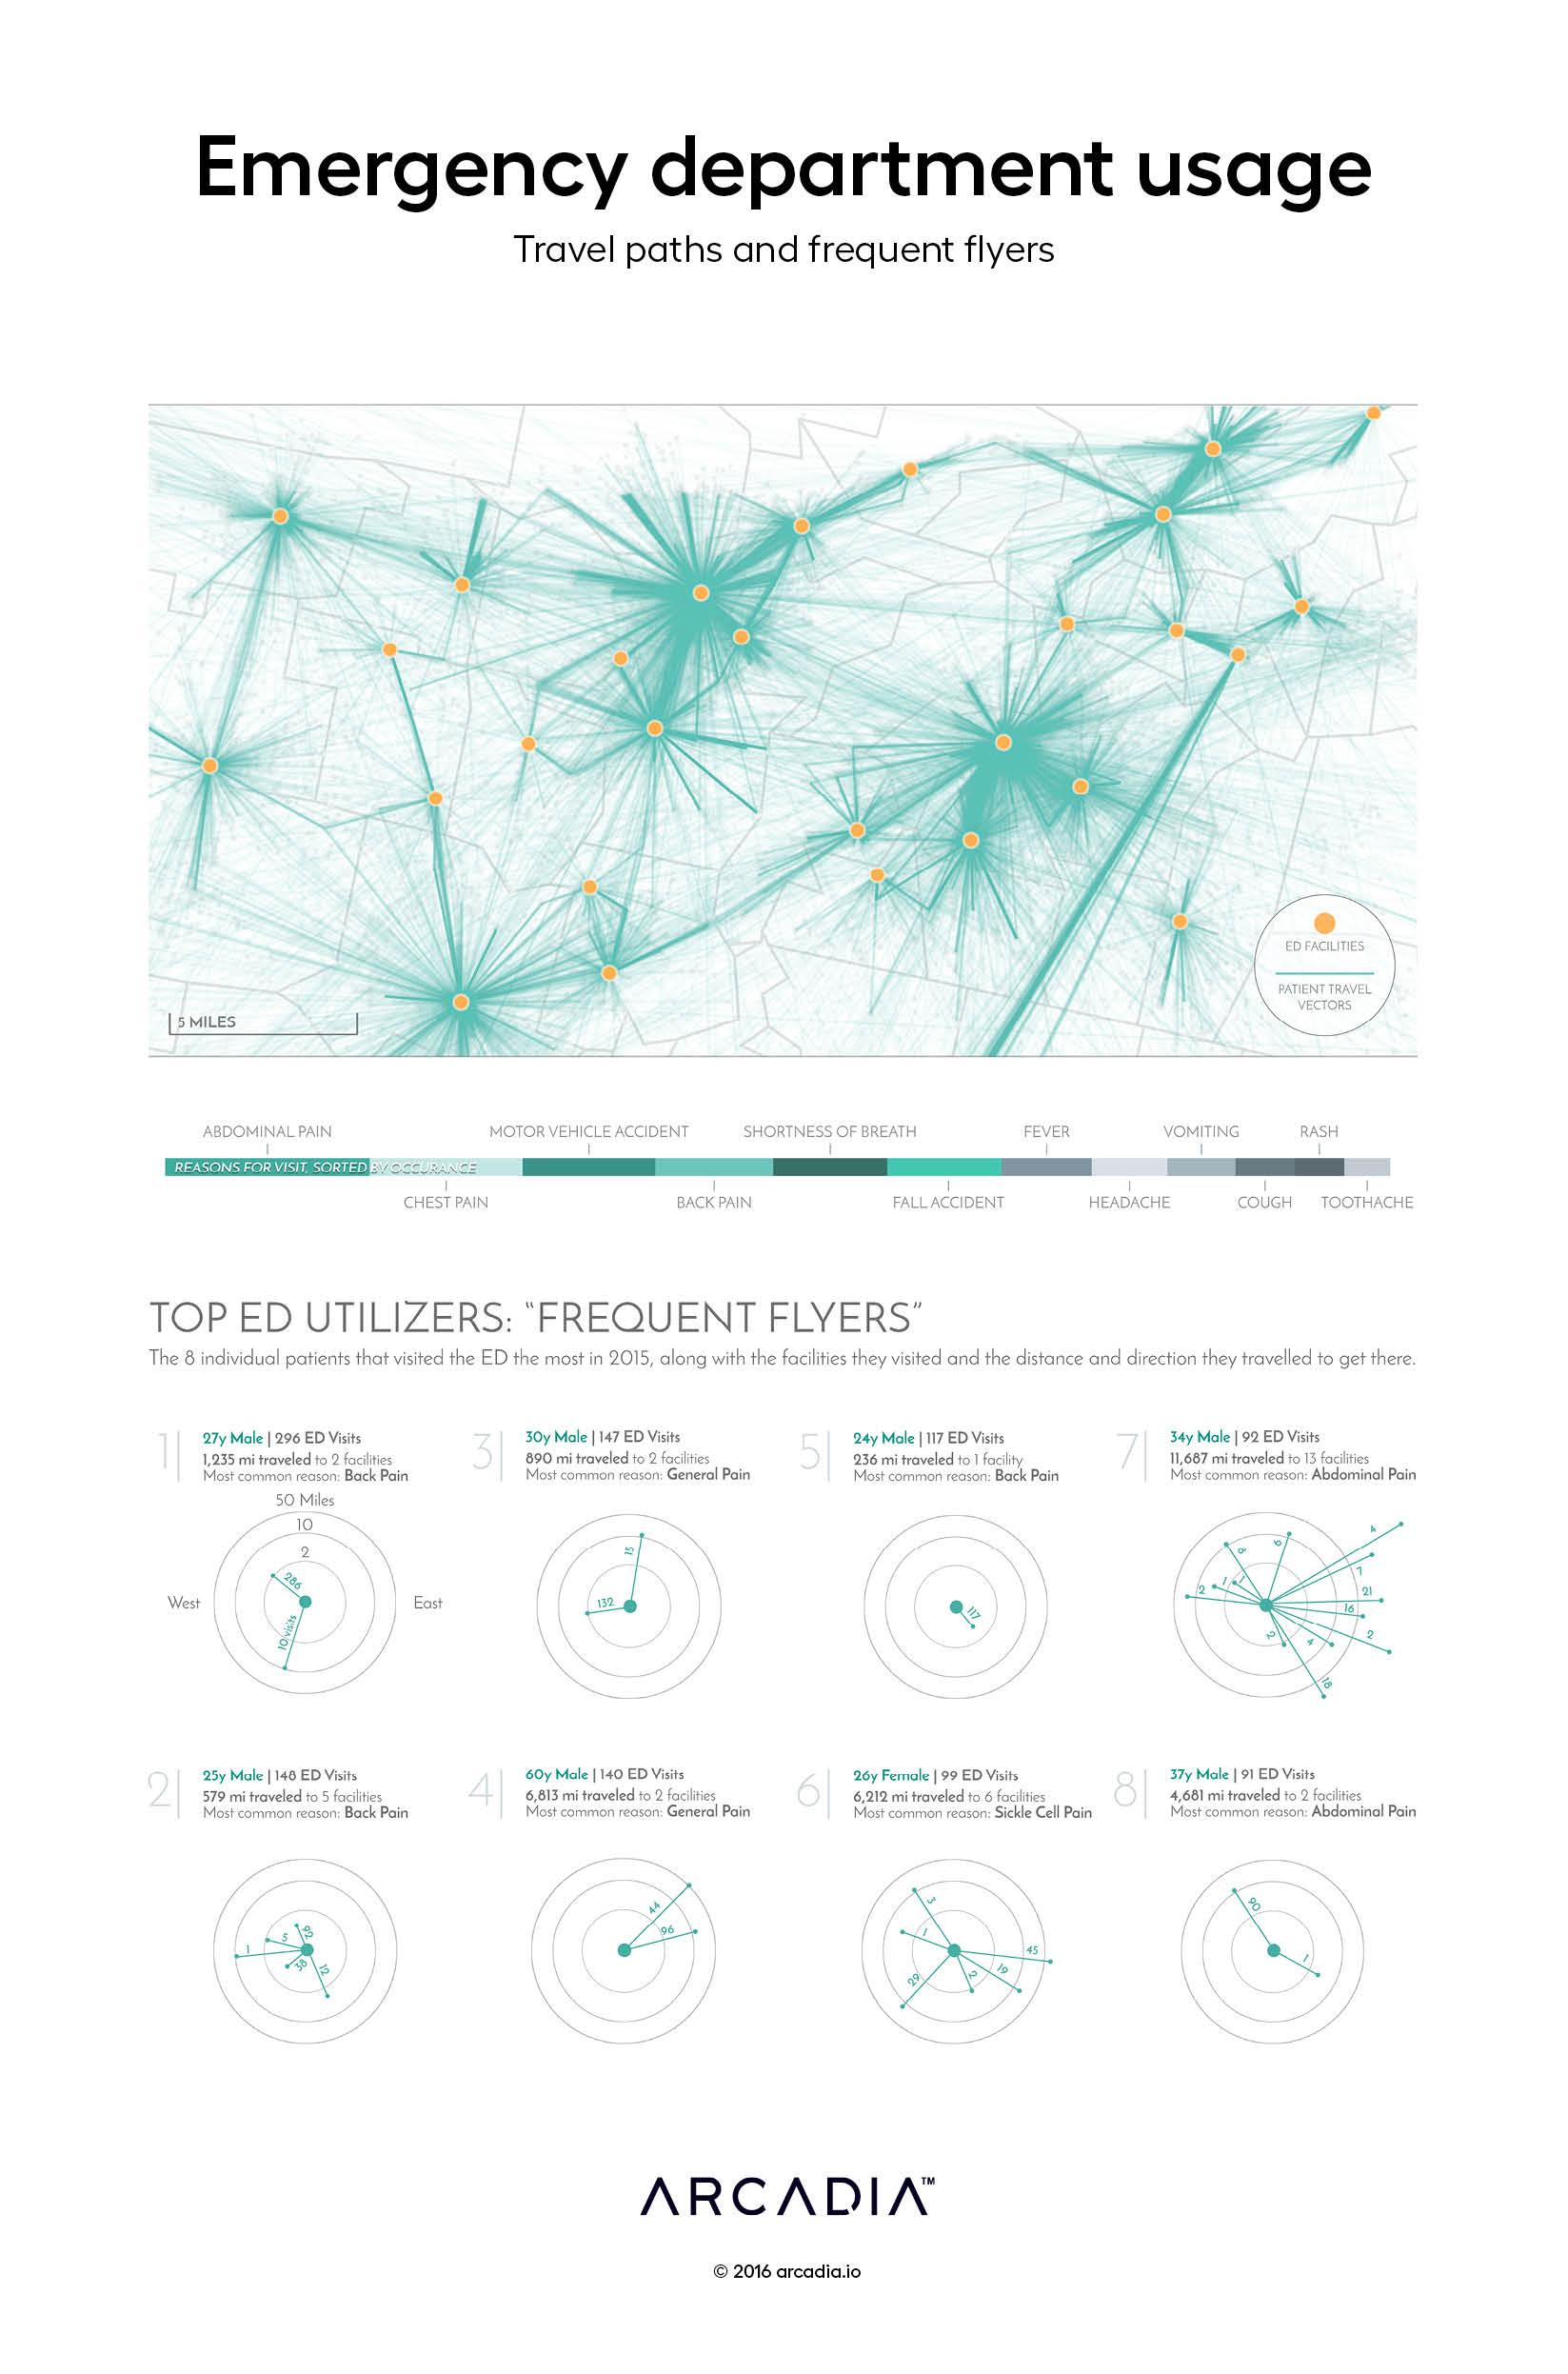
A large map displays hundreds of thousands of patient travel vectors (teal lines) from their home to the ED facility (orange circles). This creates star-like figures showing the geographical reach that these facilities have. Looking at the reasons for the visit, we find significant utilization of Emergency services for what are frequently non-emergent conditions like Back Pain, Abdominal Pain, and Headaches.
By mining data from dozens of ED facilities and applying a Master Patient Index across the disparate dataset, Arcadia can track those patients that visit multiple different facilities over the course of the year. Toward the bottom half of the page, we look at 8 patients that went to the ED the most in 2015. Many of these patients make the journey to the Emergency Department twice a week, with one notably appearing 296 times in a single year.
A circular visual provides context as to the direction and distance the patient in question travels to receive these services from the different facilities they have visited, with one patient notably traveling 12,000 miles in a given year to visit 13 different ED facilities.
Details
SQL, D3.js SVG, with Illustrator Data sourced from Arcadia Benchmark Database with multiple EHR and Claims datasets
According to research from the CDC, approximately 129 million (nearly 40%) of people in the United States have at least one major chronic disease. Five of the top 10 leading causes of...
Whether operating under value-based care (VBC) contracts or traditional fee-for-service (FFS) models, improving care quality while managing costs is a major priority across the...
Arcadia, a leading healthcare data platform, and Nordic Capital, a premier private equity investor in healthcare and technology, today announced a strategic partnership where Nordic...