Insight
What Is Healthcare Analytics? The Definitive Guide
Healthcare analytics refers to the thoughtful use of data and statistical analysis techniques in the healthcare industry. Read this guide to learn more.

Long-haul COVID. It’s one of the many new pandemic-related phrases and words that have become part of our daily news streams. Long-haul COVID is the term used to describe signs and symptoms that develop after acute COVID-19 that are not explained by an alternative diagnosis. Despite that simple description, both the causes and effects of Long COVID on the human body remain both complex and unclear.
Long COVID can take many forms, from persisting symptoms that continue for months after the infection has initially run its course, to novel conditions or symptoms that emerge weeks or months after infection.
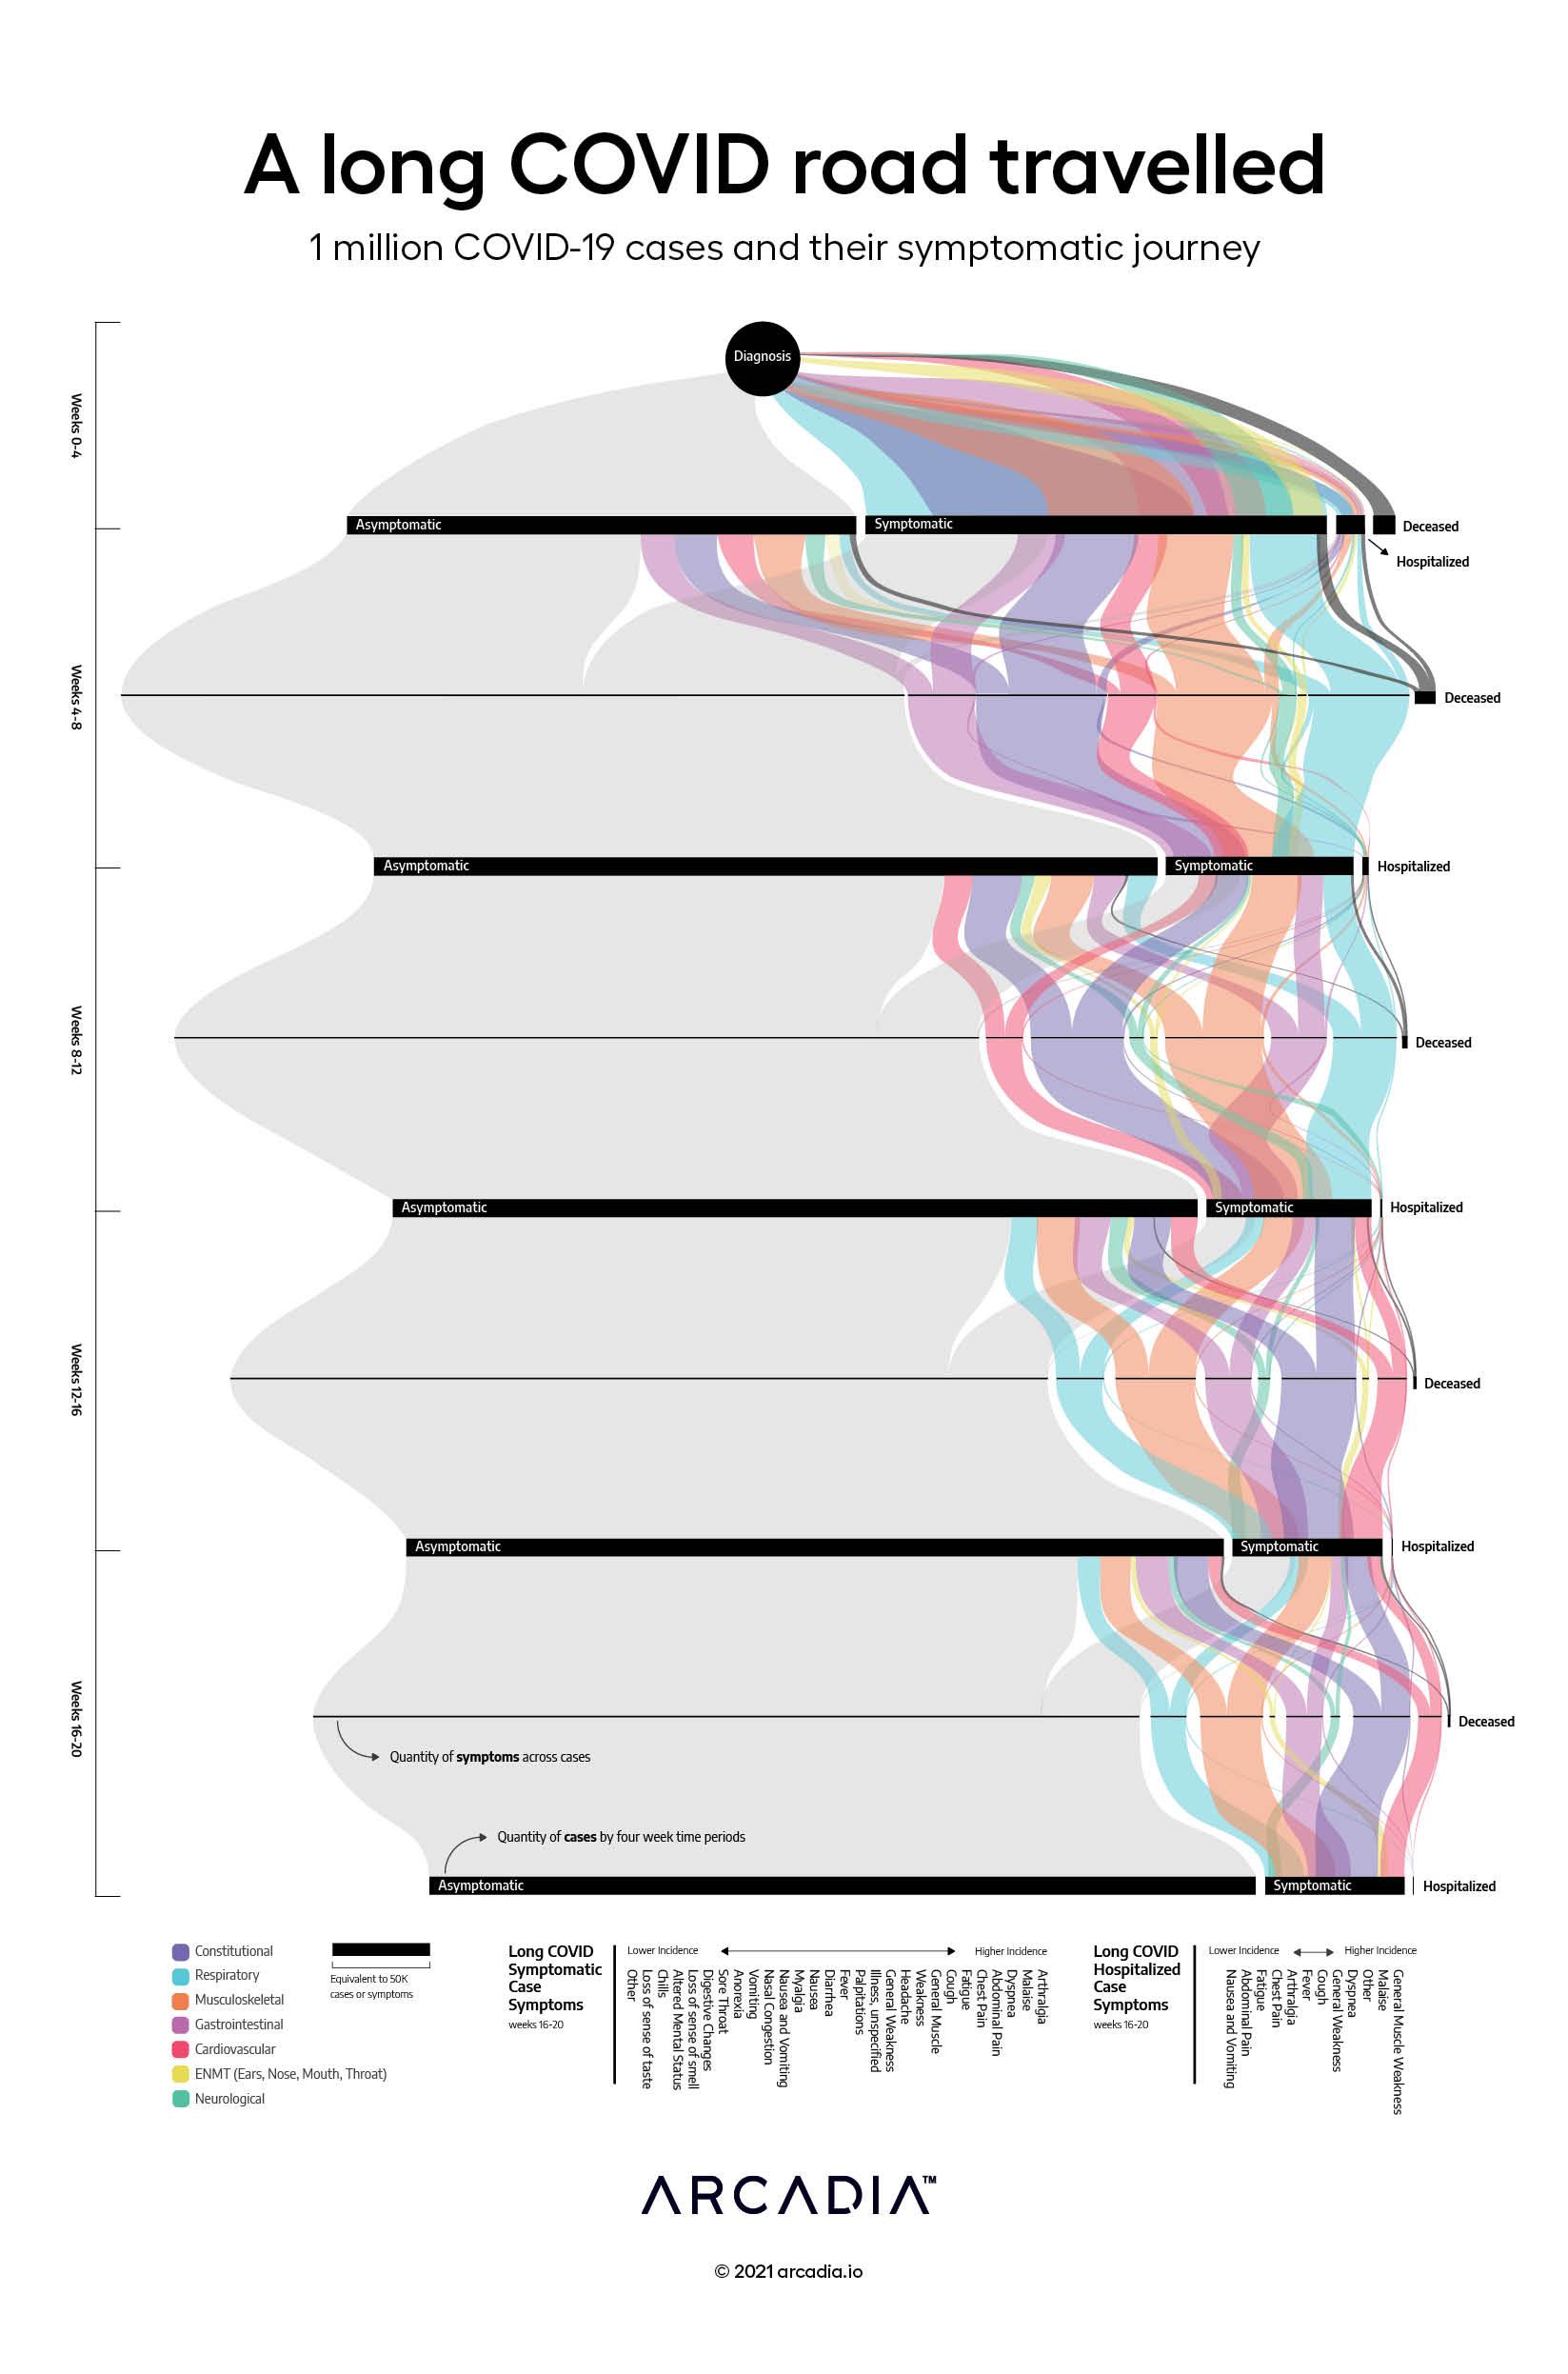
For many patients, recovery from COVID-19 is not a smooth path from sickness to health, but rather a convoluted journey with many starts and stops, twists and turns. For some more fortunate patients, symptoms can be short and devoid of features. But for others, the journey back to health is long and arduous and littered with trials to overcome. Adding to the mix is the unpredictability of long-haul COVID — a patient’s medical condition or symptoms can change without much warning.
A Long COVID Road Travelled provides a visual sense of this journey. Modeled on a traditional Sankey diagram with color variation applied to highlight symptomatic patterns, this figure invites the viewer to take a journey. A fortunate traveler follows a straight path from sickness to health, with few or no symptoms from onset on. But for far too many, the journey is laced with symptoms that don’t seem to end. For all the hospitalized patients that are out of that setting within a few weeks, many remain hospitalized month after month.
The chain of colors tying the nodes together—some random and unpredictable, some quiet and promising, some visibly recurring and seemingly unshakeable — map a journey, sometimes short, sometimes seemingly unending, as month after month passes.
RAWGraphs, Excel and Illustrator
Data sourced from Arcadia Data Research Dataset