Real-time quality improvement: Care gap opportunities in a typical day

Meaningful change management and quality improvement requires frequent and near real time visibility into performance. It’s unfortunate, then, that many organizations rely on highly infrequent measurement, assessing performance on quarterly or even annual cycles. Part of the challenge is that many organizations and performance software rely on claims data alone, which arrives anywhere from 30 to 90 days after the service date.
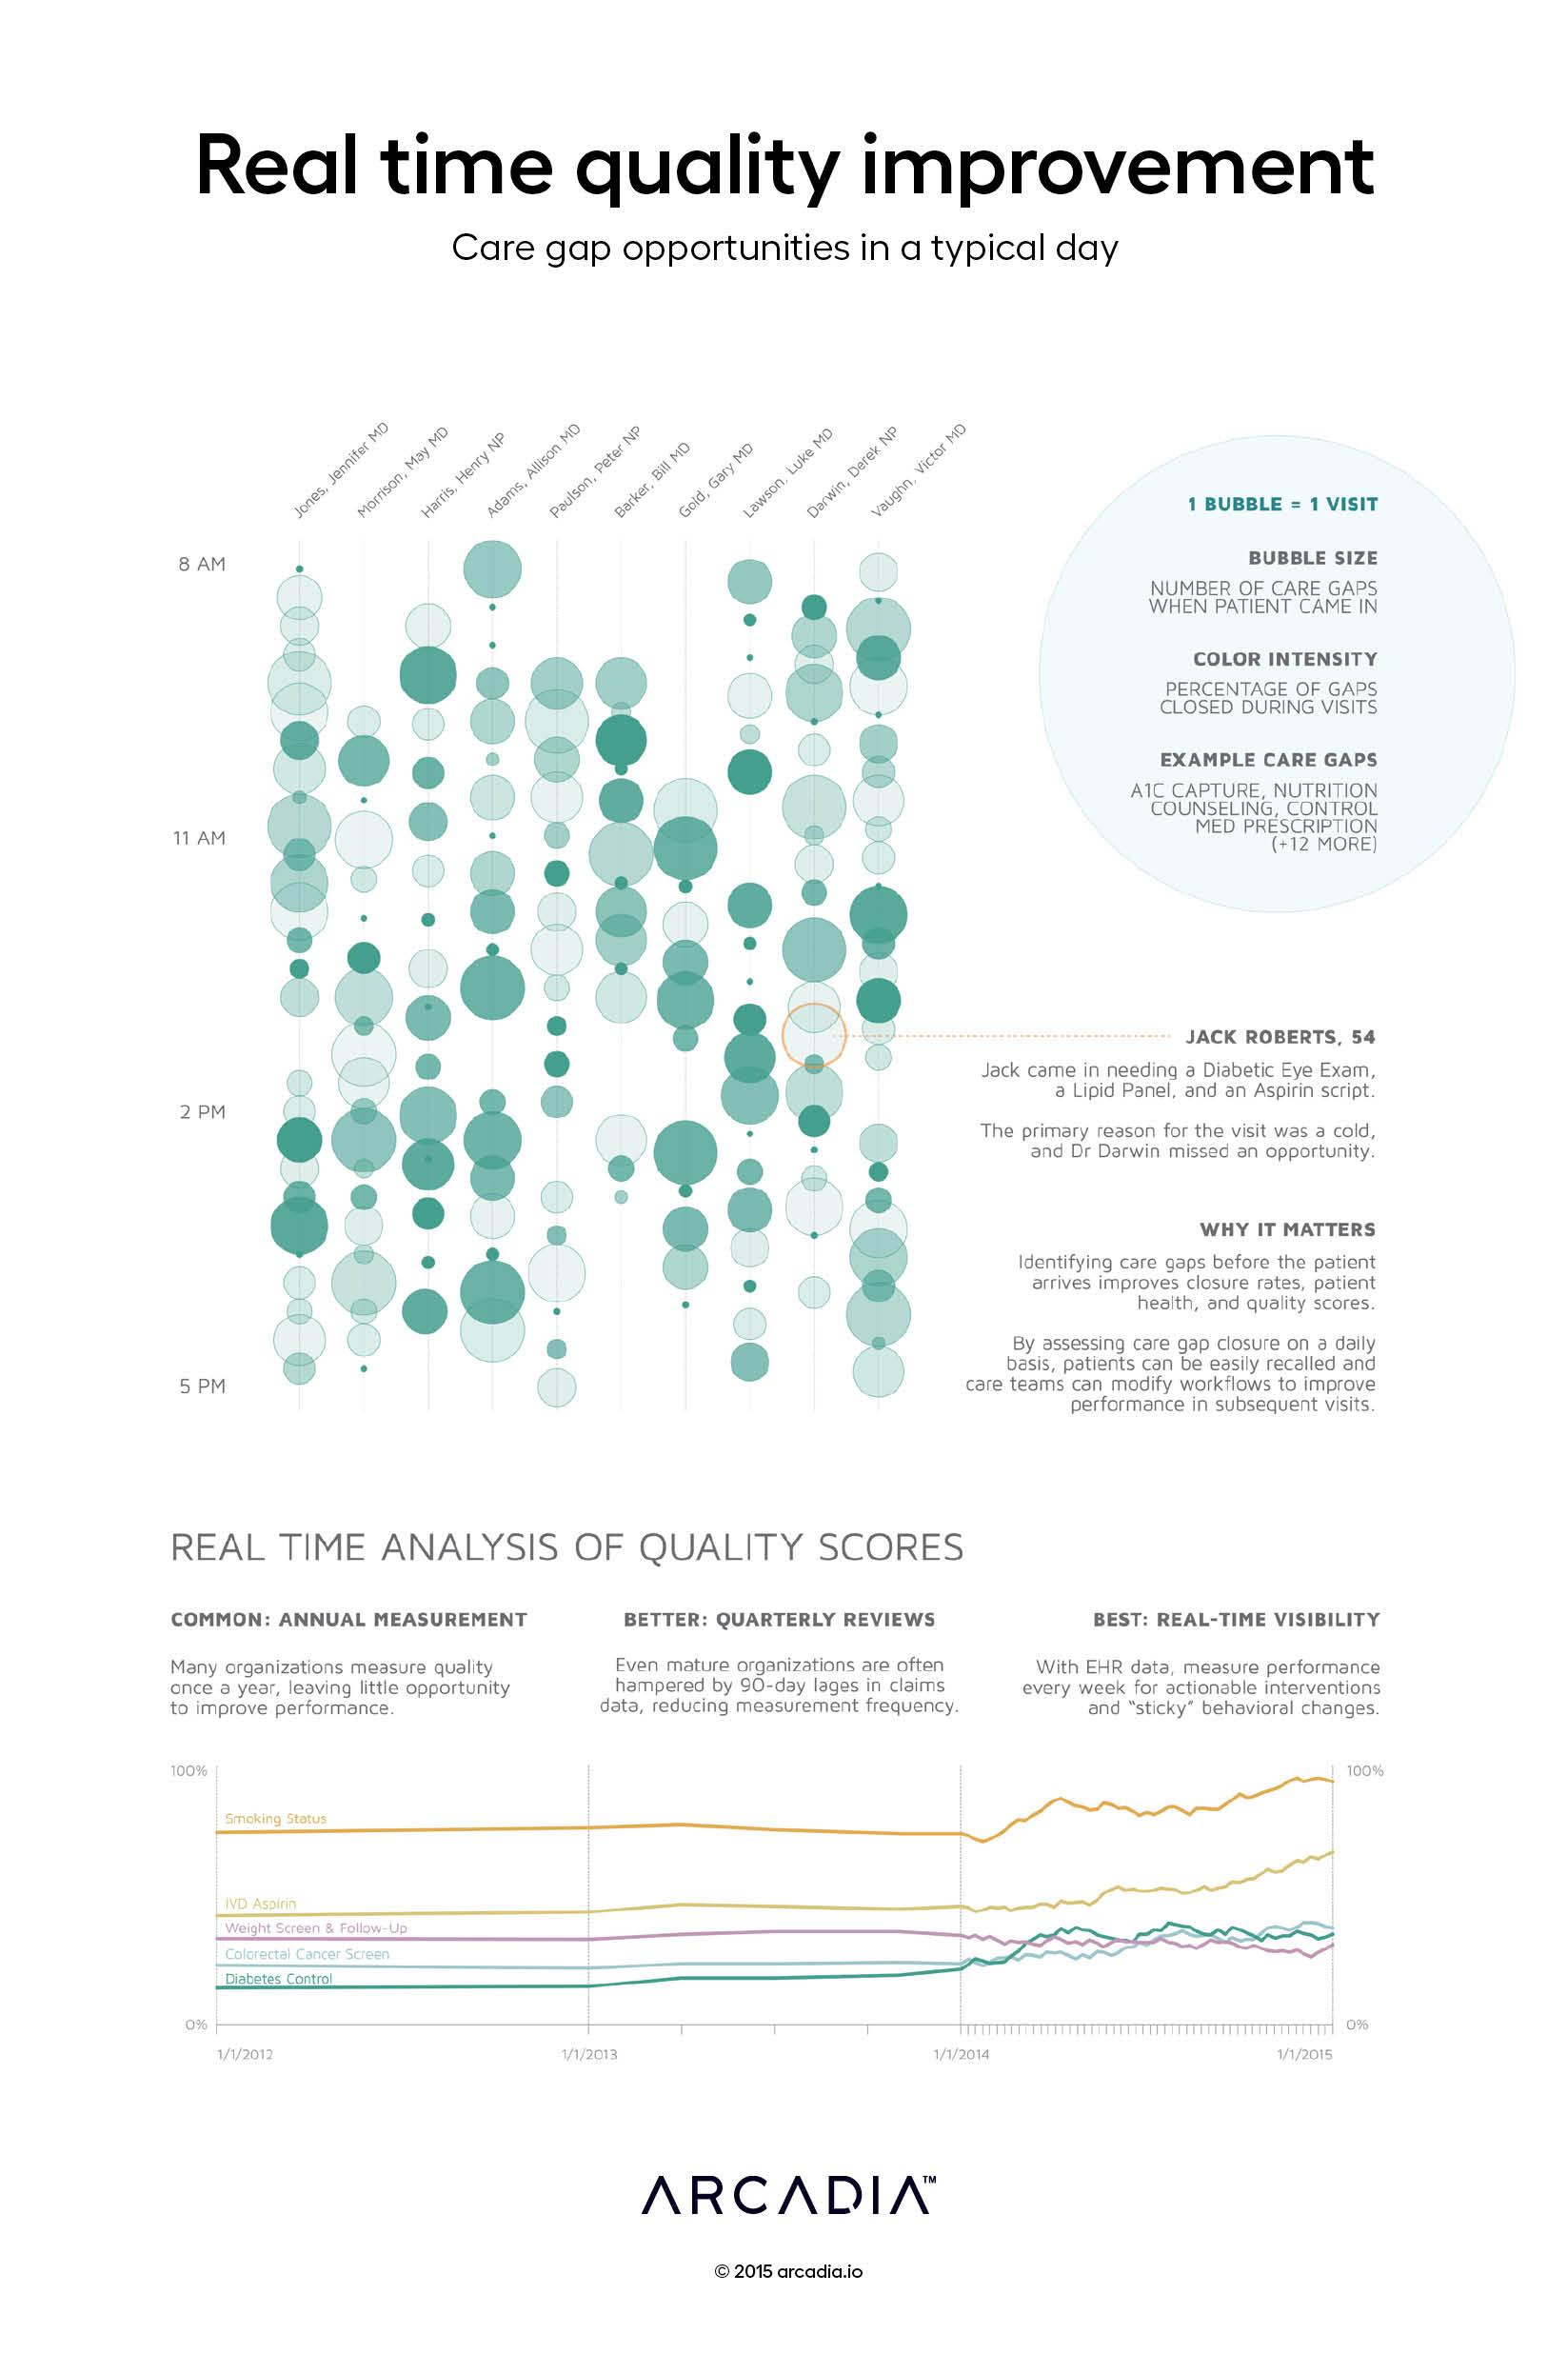
The top graph uses EHR data to display care gaps for every patient before they come in for their appointment, and the percentage of those gaps that were closed during or shortly after the visit. Arranged by rendering provider and stacked by appointment time, each bubble represents a single visit, with size indicating the number of care gaps and color showing how many were closed. Administrators and quality directors can view these charts at the end of every day to correct behavior or trigger recalls for certain patients.
On the bottom, we look at performance of 5 quality measures across 3 years. In the first year, performance is measured annually (and is relatively flat). In the second year, quarterly reviews provide some additional granularity and opportunities to correct behavior. The third year shows performance monitoring with real time EHR data. High frequency measurements increase agility in the organization’s quality program, support iterative behavior corrections, and drive significantly improved outcomes.
Details
D3.js SVG, with Illustrator
De-identified care gaps from Claims and EHR dataset from commercial ACO
