Small data, big data: A diabetic self portrait

Health data sourced from personal on-body devices open new opportunities for analysis, and corresponding opportunities to personalize medicine and hopefully deliver better patient care. However, the healthcare community still struggles to fully leverage data sources that have been in existence for half a century. This leaves many at a loss for how to explore device data, and with only limited understanding of the value it can bring.
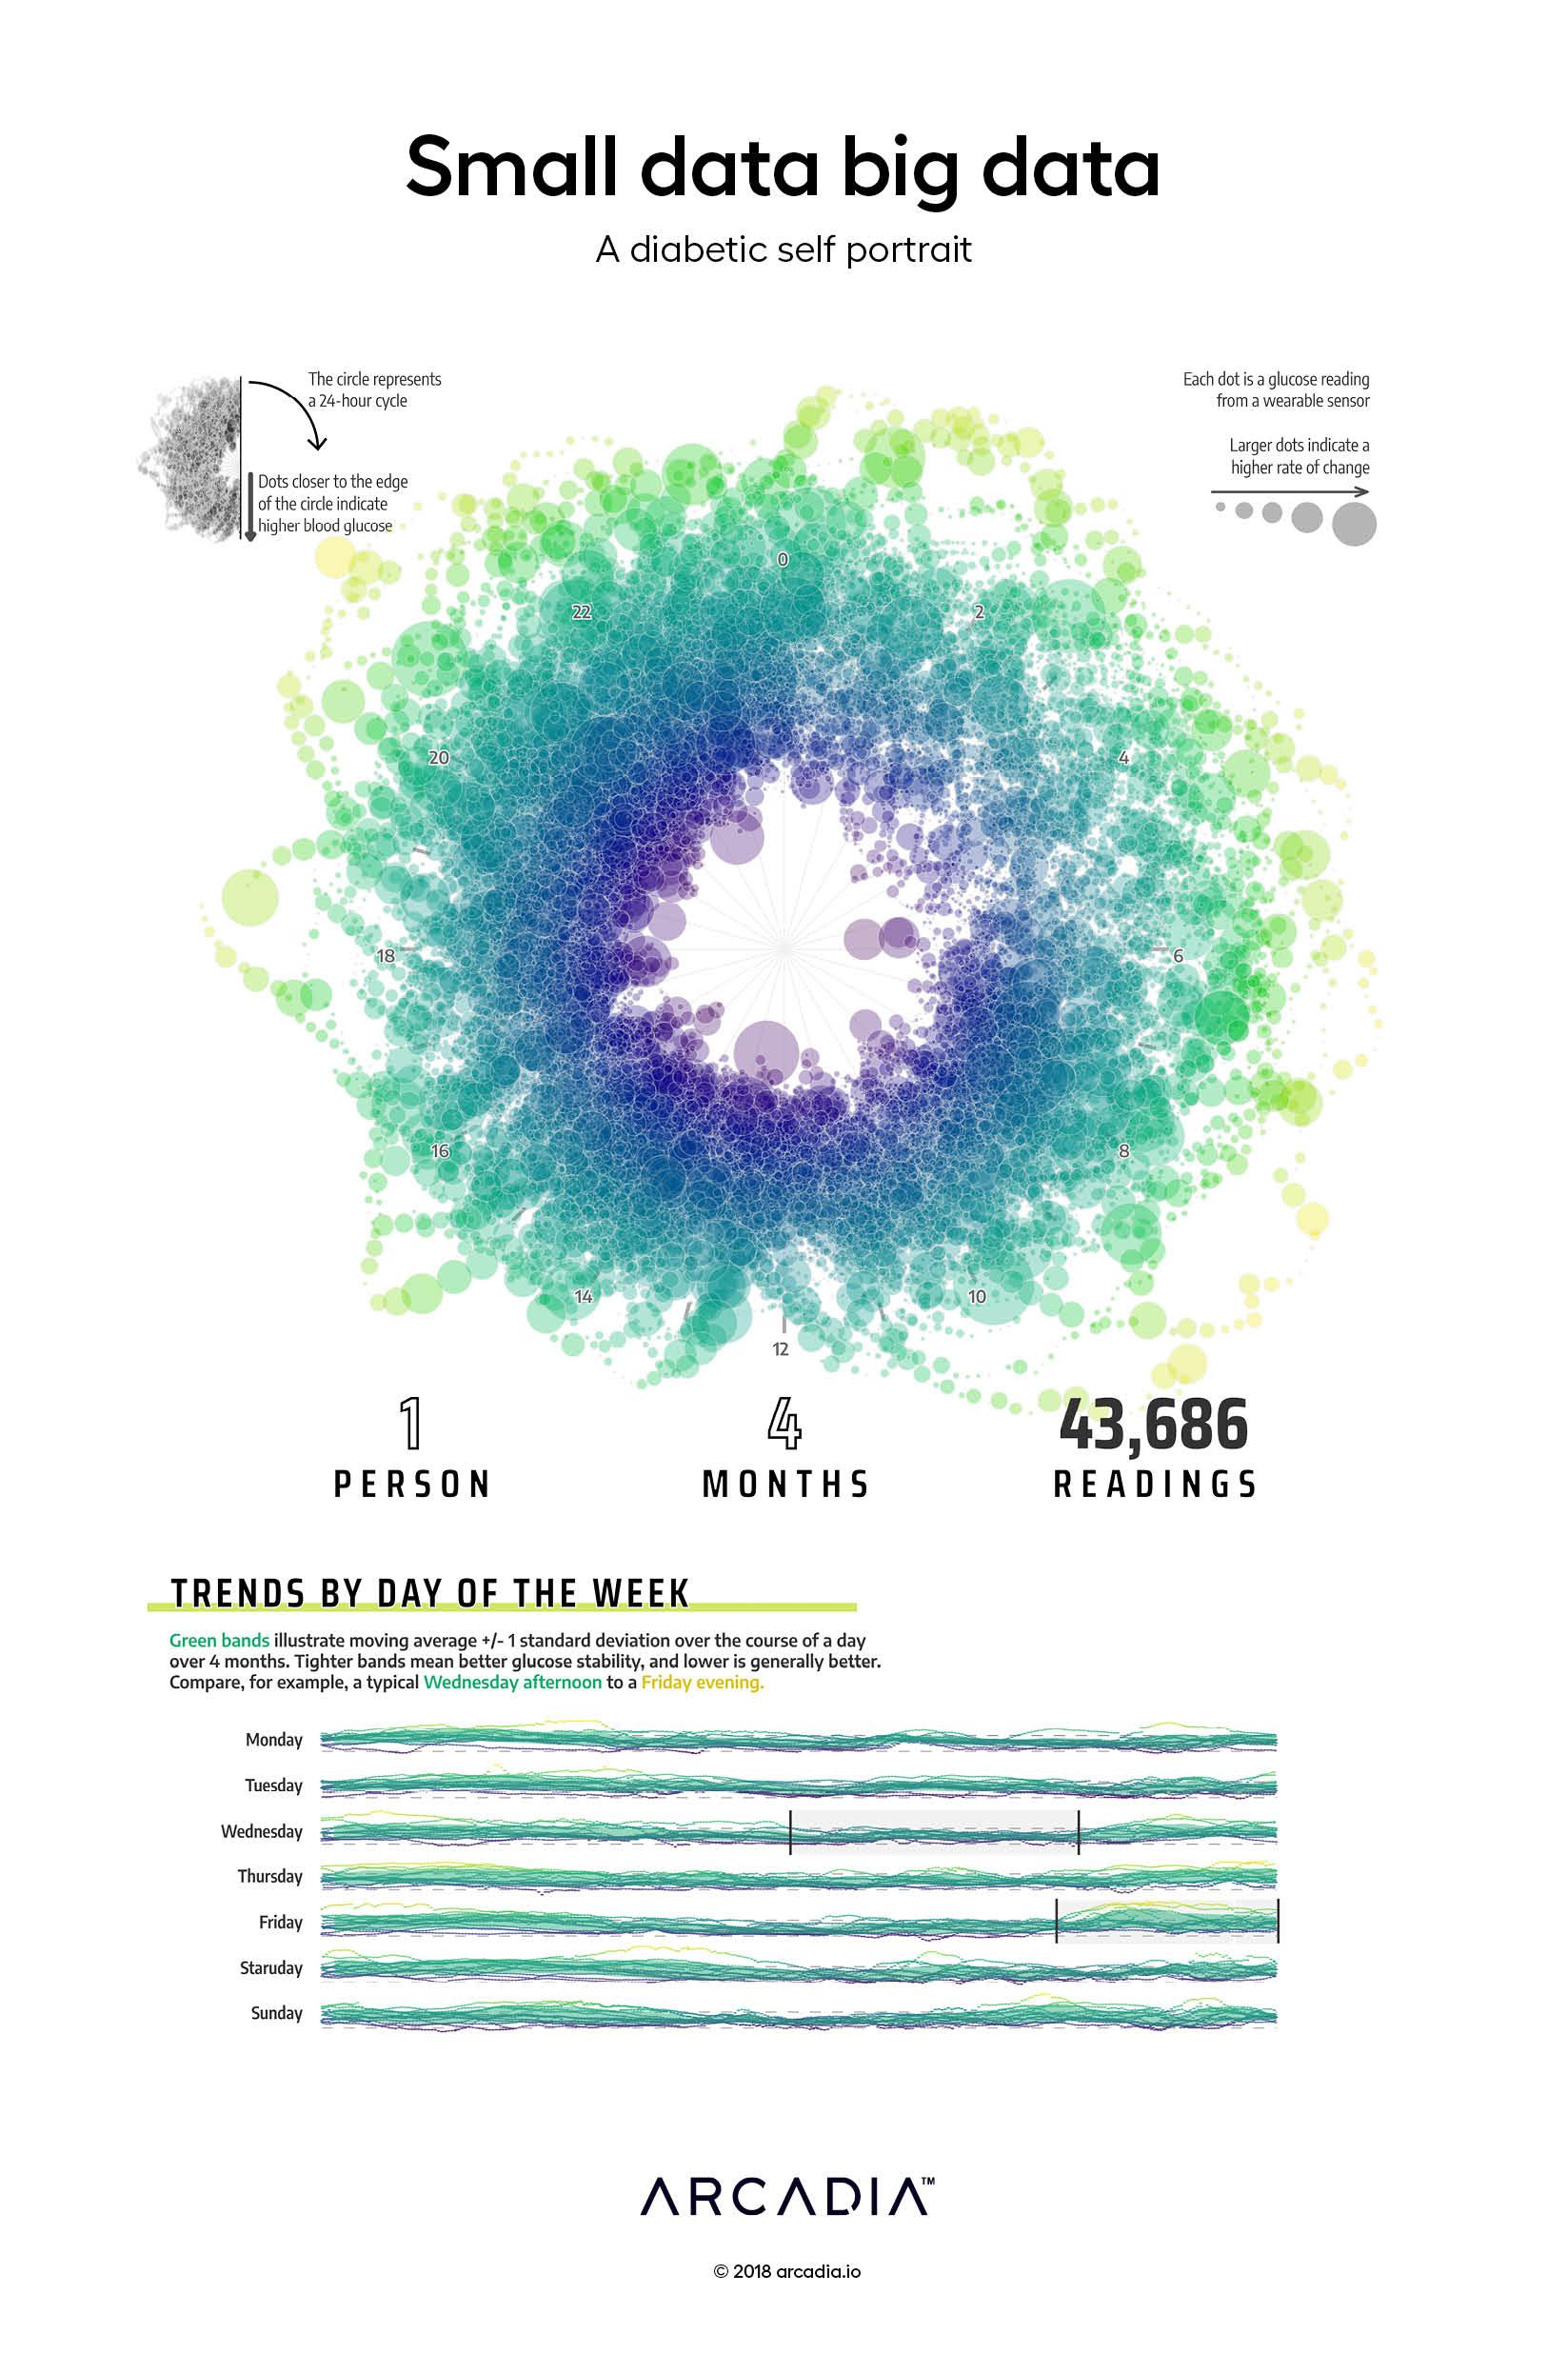
In this figure, the artist provides a very personal view into his own health through data generated from a continuous glucose monitor. The 43,686 readings presented here are taken from the 300+ daily readings captured over a 24-hour period by the device. These readings are depicted as both a near-raw form, representing the chaotic complexity of this kind of data, and smoothed out as a flowing set of data grouped by day of the week.
While trends can certainly be identified, as exemplified by the artist’s playful invitation to explore the variances in glucose readings between a Wednesday afternoon and Friday evening, many questions remain. The data is certainly valuable in the moment, and against a handful of trailing values, but across time, or a population, much more research is needed to evaluate the efficacy of this kind of data to support population health.
Details
Python/Plotly Dash, with Illustrator
Data sourced from personal Continuous Glucose Monitor (CGM) history data
