This site uses cookies that are essential for our site to work. We would also like to use non-essential cookies to help us improve your browsing experience and help make this website better, by collecting and reporting information on how you use our site.
The cost of common, chronic comorbidities — on the healthcare system, on productivity, on quality of life — are well known at this point, and yet cannot be overstated. The presence of multiple comorbidities amplifies the effect, with some combinations offering a literally morbid synergistic effect on health and cost.
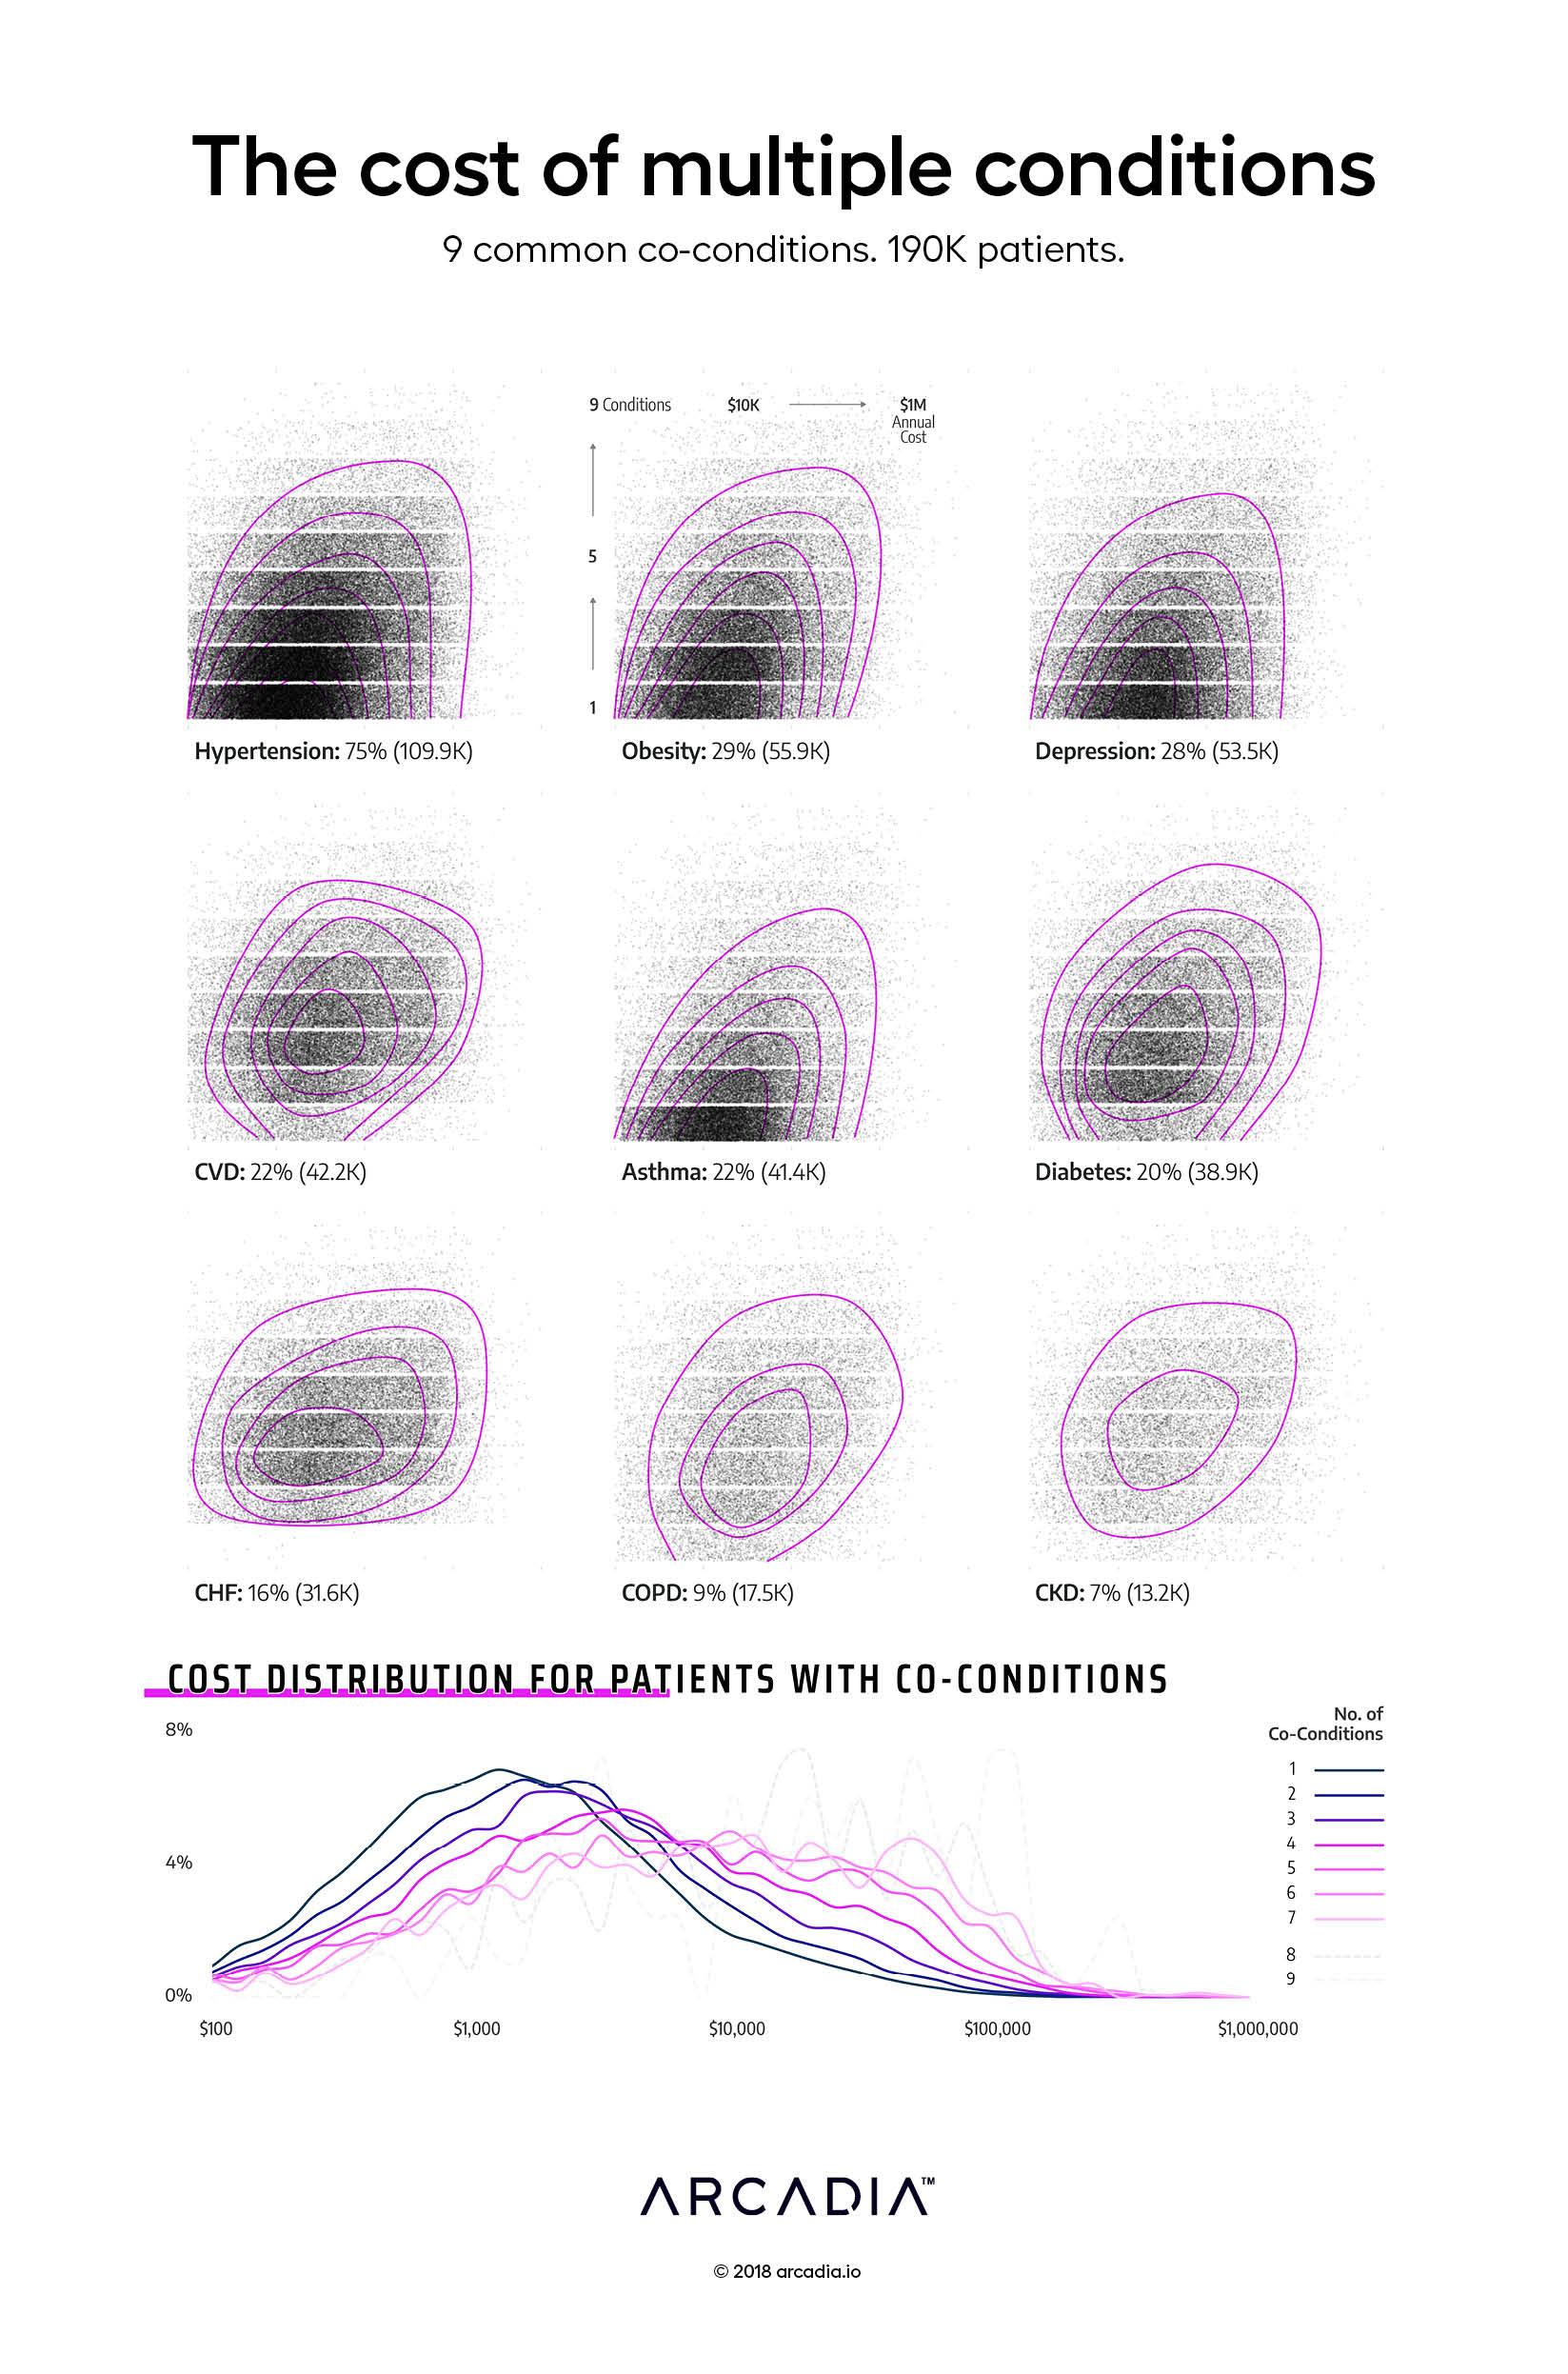
In contrast, the limits of these comorbid interactions become visually evident in the artist’s new take on multiple comorbidity. Nine major conditions are expressed in this figure; every dot in the upper lattice represents an individual, totaling over 404,167 conditions over 191,834 patients. The y-axis (categorical) of each figure represents the number of co-morbid conditions, while the x-axis (scaled logarithmically) represents the annual cost of care for the individual. Contour lines have been added to assist in identification of density trends.
The fingerprint-like stamp of each condition suggests a grouping: First, there are those that are found in great numbers alone or with fewer than three additional conditions — hypertension, obesity, depression, and asthma — presenting a lower mean cost but a trend to rapidly increasing cost with additional comorbidities. And then there are those that are more likely to be found in the company of other chronic conditions — CVD, CHF, COPD, and CKD — presenting a higher cost with greater within-group variability and less correlation between cost and comorbidities. That diabetes visually sits between the first four and second four is both telling and intriguing.
Although these groupings may simply be a broad statement about incidence within large populations, they also hint at similar attributes, opening up new questions about what influences the penetrance of a condition into a population.
The artist offers one additional statement, a literal postscript rather than central finding, in the form of the cost distribution at the bottom. Not unexpectedly, the distribution of costs rises with the number of comorbidities. Yet this figure also offers a different take on the results above it, suggesting a limit to the correlation in cost versus comorbidity count, and an opportunity for other factors — some perhaps within the patient’s control — to take over that variability.
Details
SQL, Excel, with Illustrator Data sourced from Medicaid, Commercial, and Medicare EHR and Claims data from the Arcadia Benchmark Database
Aggregate Training Day offers a customizable learning experience designed to meet you where you are — and take you further. Whether you’re diving into advanced platform capabilities or...
According to research from the CDC, approximately 129 million (nearly 40%) of people in the United States have at least one major chronic disease. Five of the top 10 leading causes of...
Whether operating under value-based care (VBC) contracts or traditional fee-for-service (FFS) models, improving care quality while managing costs is a major priority across the...