Insight
What Is Healthcare Analytics? The Definitive Guide
Healthcare analytics refers to the thoughtful use of data and statistical analysis techniques in the healthcare industry. Read this guide to learn more.

For all our efforts to preserve and maintain health and quality of life, an equally important but often overlooked conversation surrounds how our lives come to an end. Approximately 30% of Medicare costs are attributed to the 5% of beneficiaries who die each year, with 78% of those costs stemming from life-sustaining acute care during the final thirty days of life. Compounding the considerable financial cost is the emotional cost of difficult choices made during this time, sometimes without full knowledge or awareness of options and likelihoods.
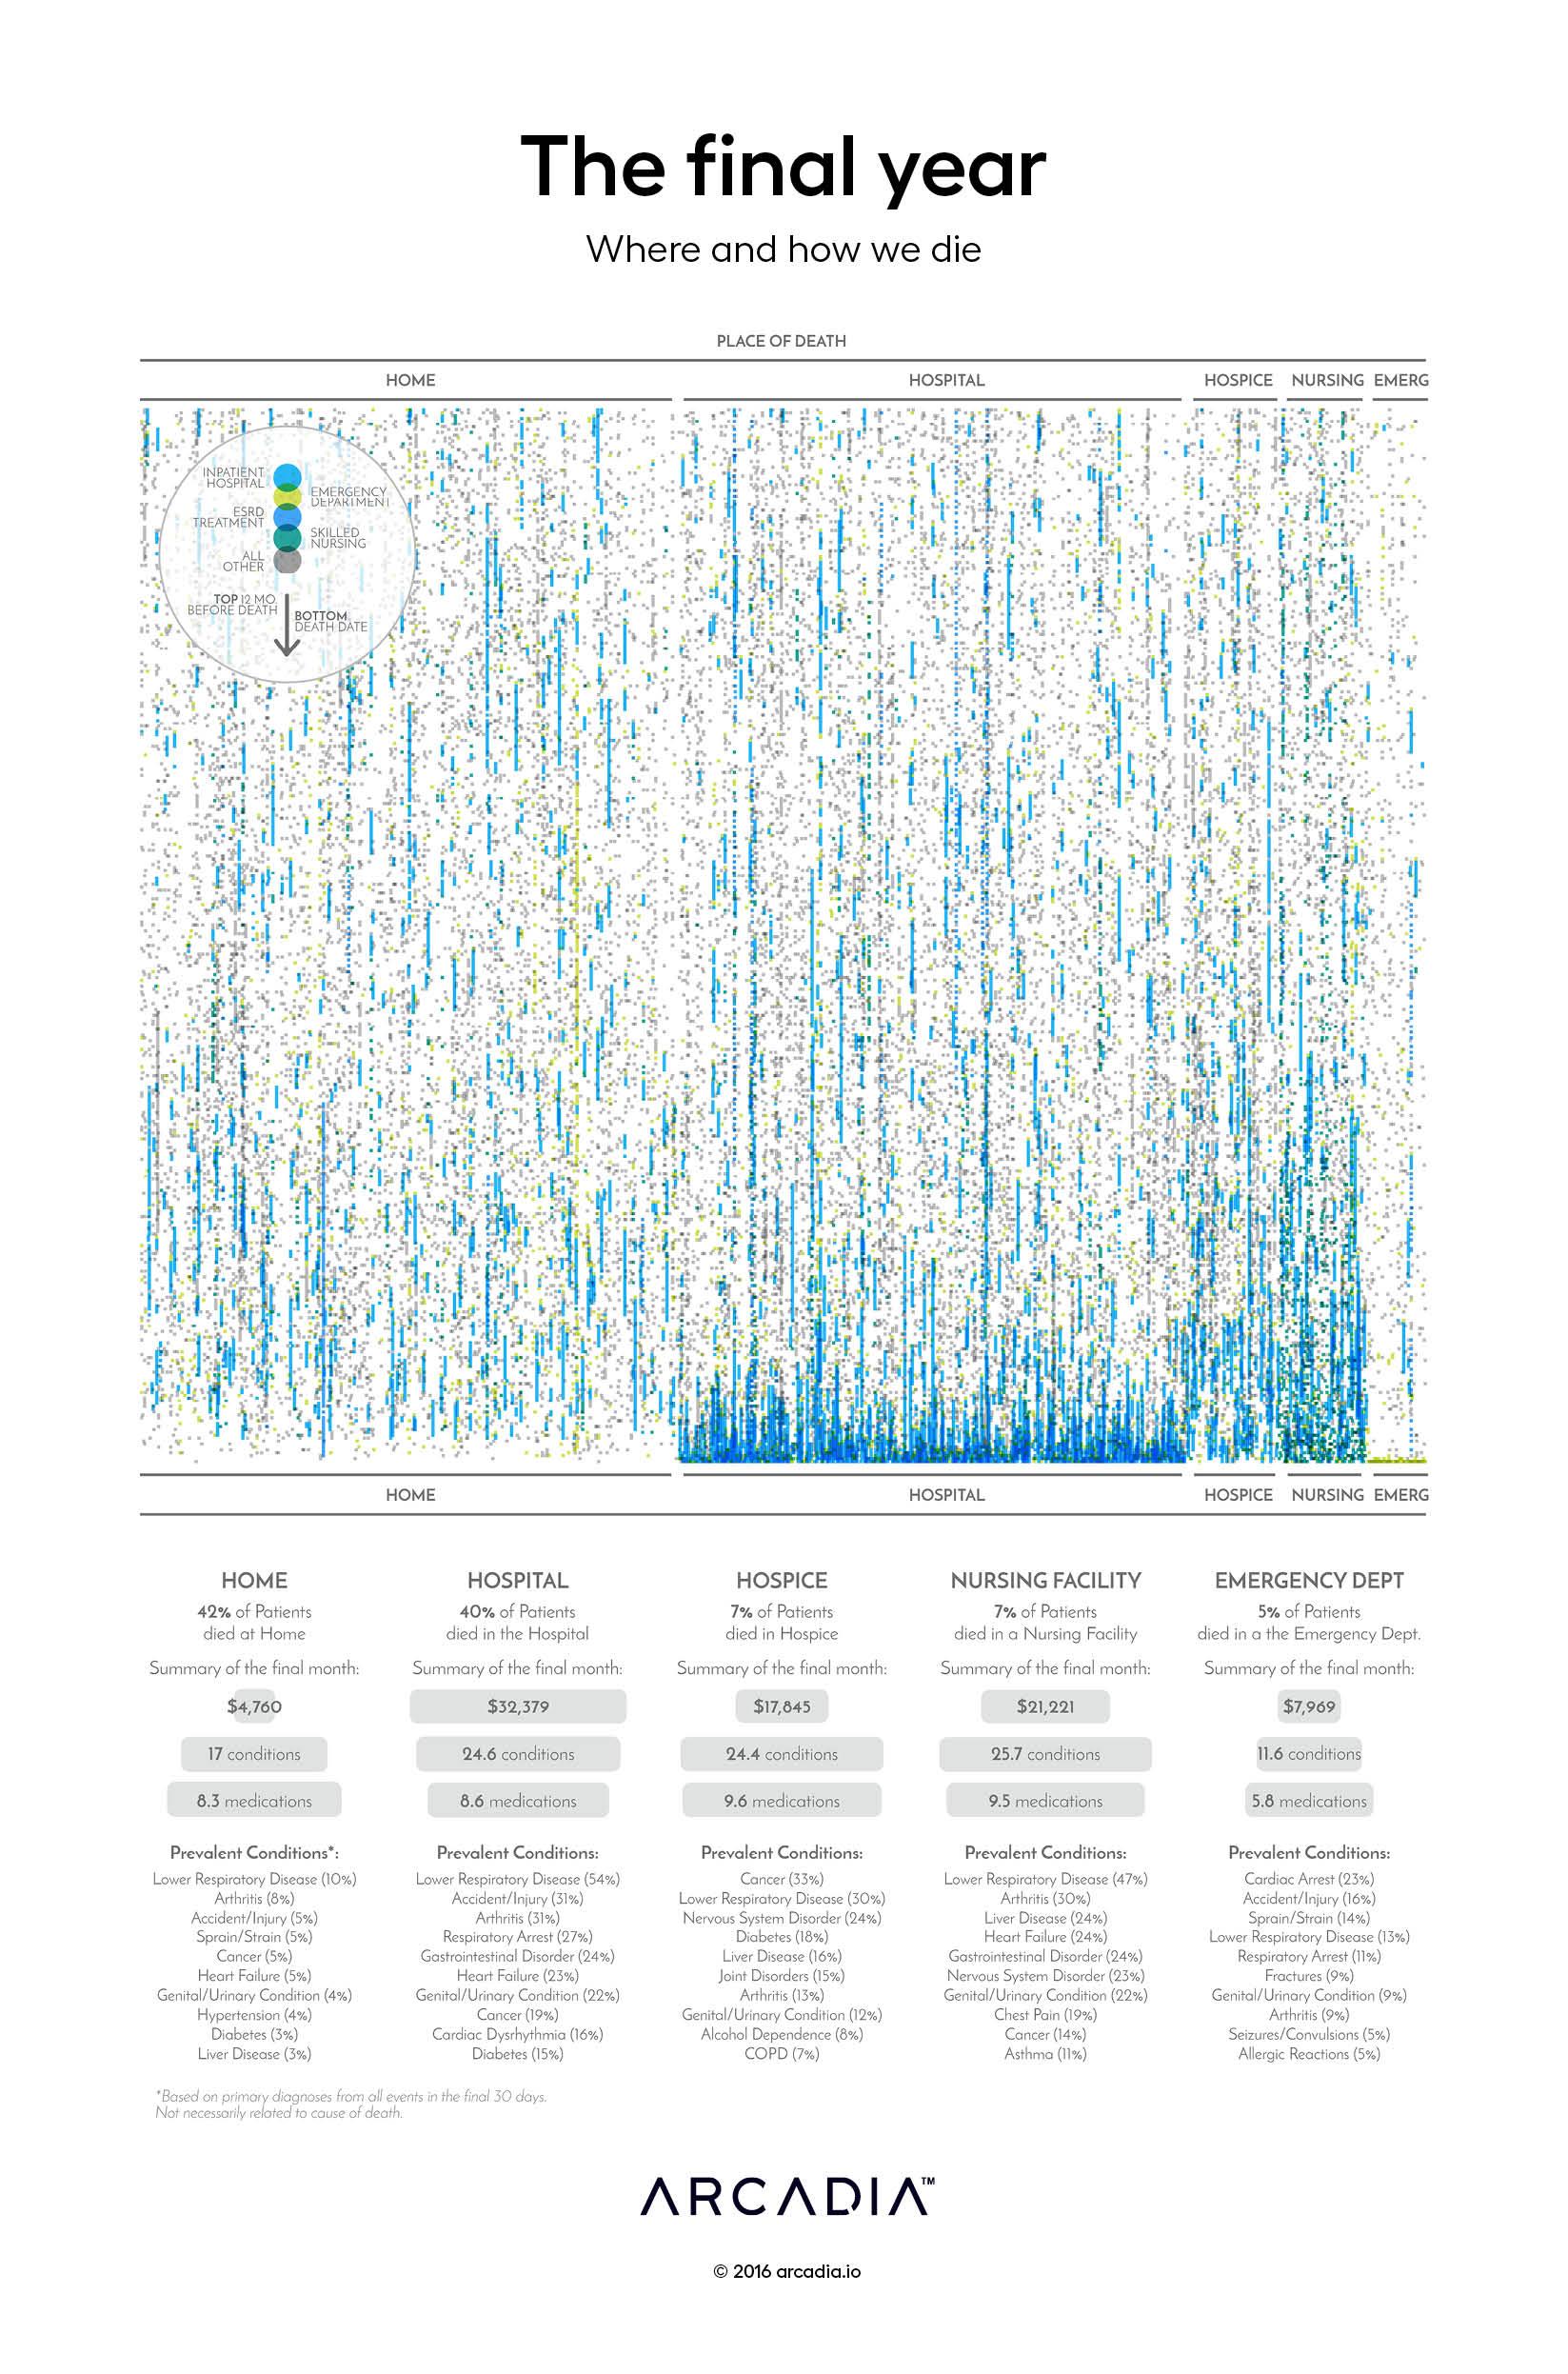
In this figure, the artist visualizes that final year of life, highlighting one of those difficult questions — Where will I die? — at the end of what is sometimes a difficult and painful path, and sometimes, by fortune or by planning, less so.
Across the horizontal axis, each of 2,398 patients who died within a five year span is represented by a single column, the columns grouped by the estimated environment in which the individual died. The columns are composed of a series of points representing interaction with the healthcare system, as identified through clinical and claims records, and colored by the place of service for the event.
The most obvious difference experienced by the patients studied here is the difference in their final month across the different places of death. Most immediately obvious is that those who die at home or hospice — in this analysis, some of those who died at hospice may be assigned to home due to lack of activity — appear to have a tapering of healthcare activity toward the end, whereas those whose end-of-life occurs in the hospital tend to spend their last days and weeks there.
A summary of costs, conditions, and prescriptions for each of these groups follows the figure. Although the artist does not try to answer some important questions about the experiences of the individuals portrayed here, and what they may have wanted their final year to be like, this visual at least offers the viewer a look into these last moments, and perhaps a bit of insight into how and where we would want our final year to be.
Explore a deeper analysis of this data visualization.
SQL, D3.js SVG, with Illustrator
Data sourced from Arcadia Benchmark Database with multiple EHR and Claims datasets