Insight
What Is Healthcare Analytics? The Definitive Guide
Healthcare analytics refers to the thoughtful use of data and statistical analysis techniques in the healthcare industry. Read this guide to learn more.

For our most complex patients — those managing multiple chronic disease, juggling dozens of medications, and navigating multiple hospitals, nursing facilities and specialists — the healthcare journey is complex and scary. In these cases, specially-trained nurse care managers and care coordinators can play a critical role in easing the path, reducing complications, and improving outcomes.
Unfortunately, these programs are often under-funded and limited in the scope of the population that they can reach. With more patients than they have care coordination resources, healthcare organizations rely on patient stratification tools to find the patients in highest need of these services.
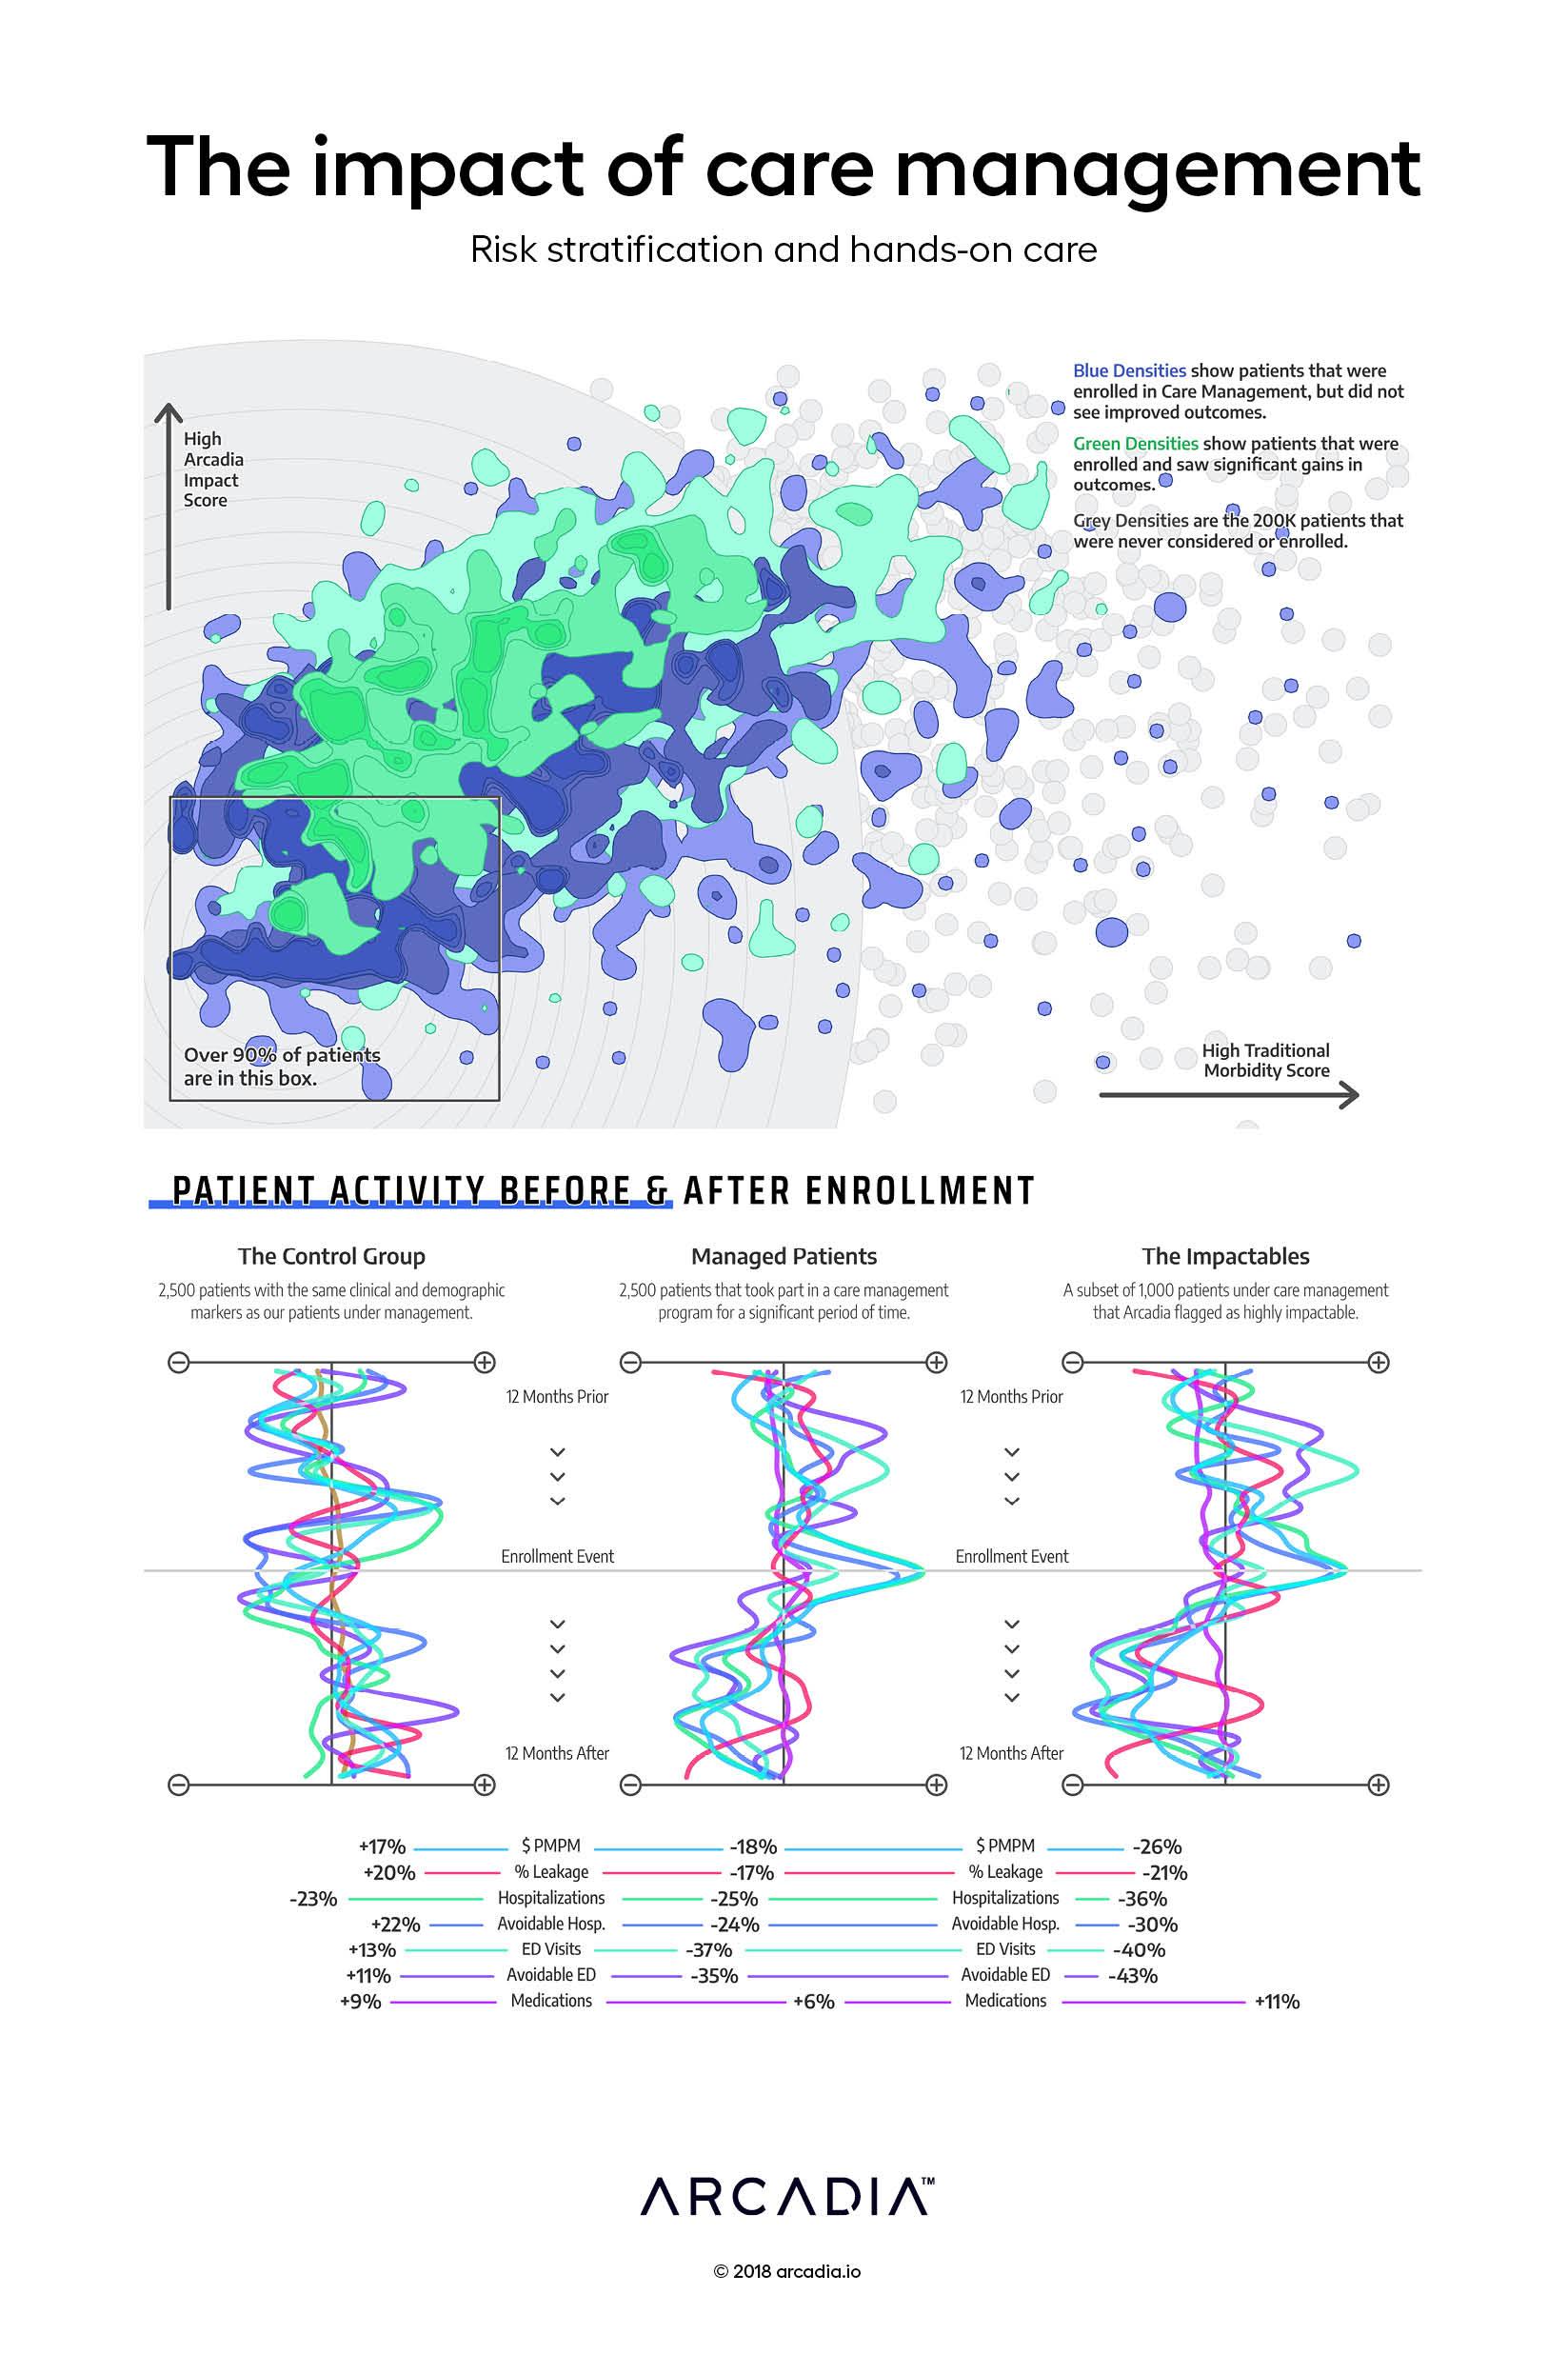
Here, the artist visualizes a traditional patient stratification method — a morbidity-based risk score — plotted against Arcadia’s own risk score, which leverages socio-economic data and other clinical and utilization markers. The analysis shows that the Arcadia score is a better predictor of success in a care management program (the green densities) than a traditional disease-based risk score.
To create this visual, the artists analyzed 200,000 patients. A little over 1% of those patients were enrolled into a complex case management program at some point. They then analyzed claims in the 12 months prior to and the 12 months after enrollment, looking for things like avoidable hospitalizations, non-emergent use of the emergency department, total cost of care, and other evidence to infer whether the program was successful in improving outcomes for the patient. The artists visualized these 2,500 patients as green or blue densities, depending on whether they were seen as successful during the program.
Below the fold, the artists use this same data to help make the case for the value of care management programs. They first create a control group — patients who look nearly identical to those enrolled in a complex case program, but who never were. For those patients, we see an exacerbation of their conditions and increases in hospitalizations, ED visits, and costs. In contrast, those in the care management program experience measurable improvements on those metrics. Finally, those that Arcadia predicted to be the most impactable see the greatest improvement of all.
SQL, Python, D3.js SVG, with Illustrator
Data sourced from Care Management Enrollment files and surrounding claims across Medicare and Commercial populations.