Webinar
Operationalizing LEAD: Network Benchmarking with Arcadia’s VBC Navigator solution
Learn about how Arcadia’s VBC Navigator solution can assist in making network decisions for LEAD participants.

Throughout 2015, CMS dramatically expanded availability of public data on Medicare utilization and costs, including payments to providers and hospitals. For the first time, raw claims data, including billed charges, were available for analysis, along with CMS-calculated quality and outcomes scores. Leading newspapers contributed to the release by offering online tools, allowing anyone with internet access to look up the billed prices and quality metrics of nearby facilities and providers. Suddenly, the general public had access to a new perspective on healthcare pricing.
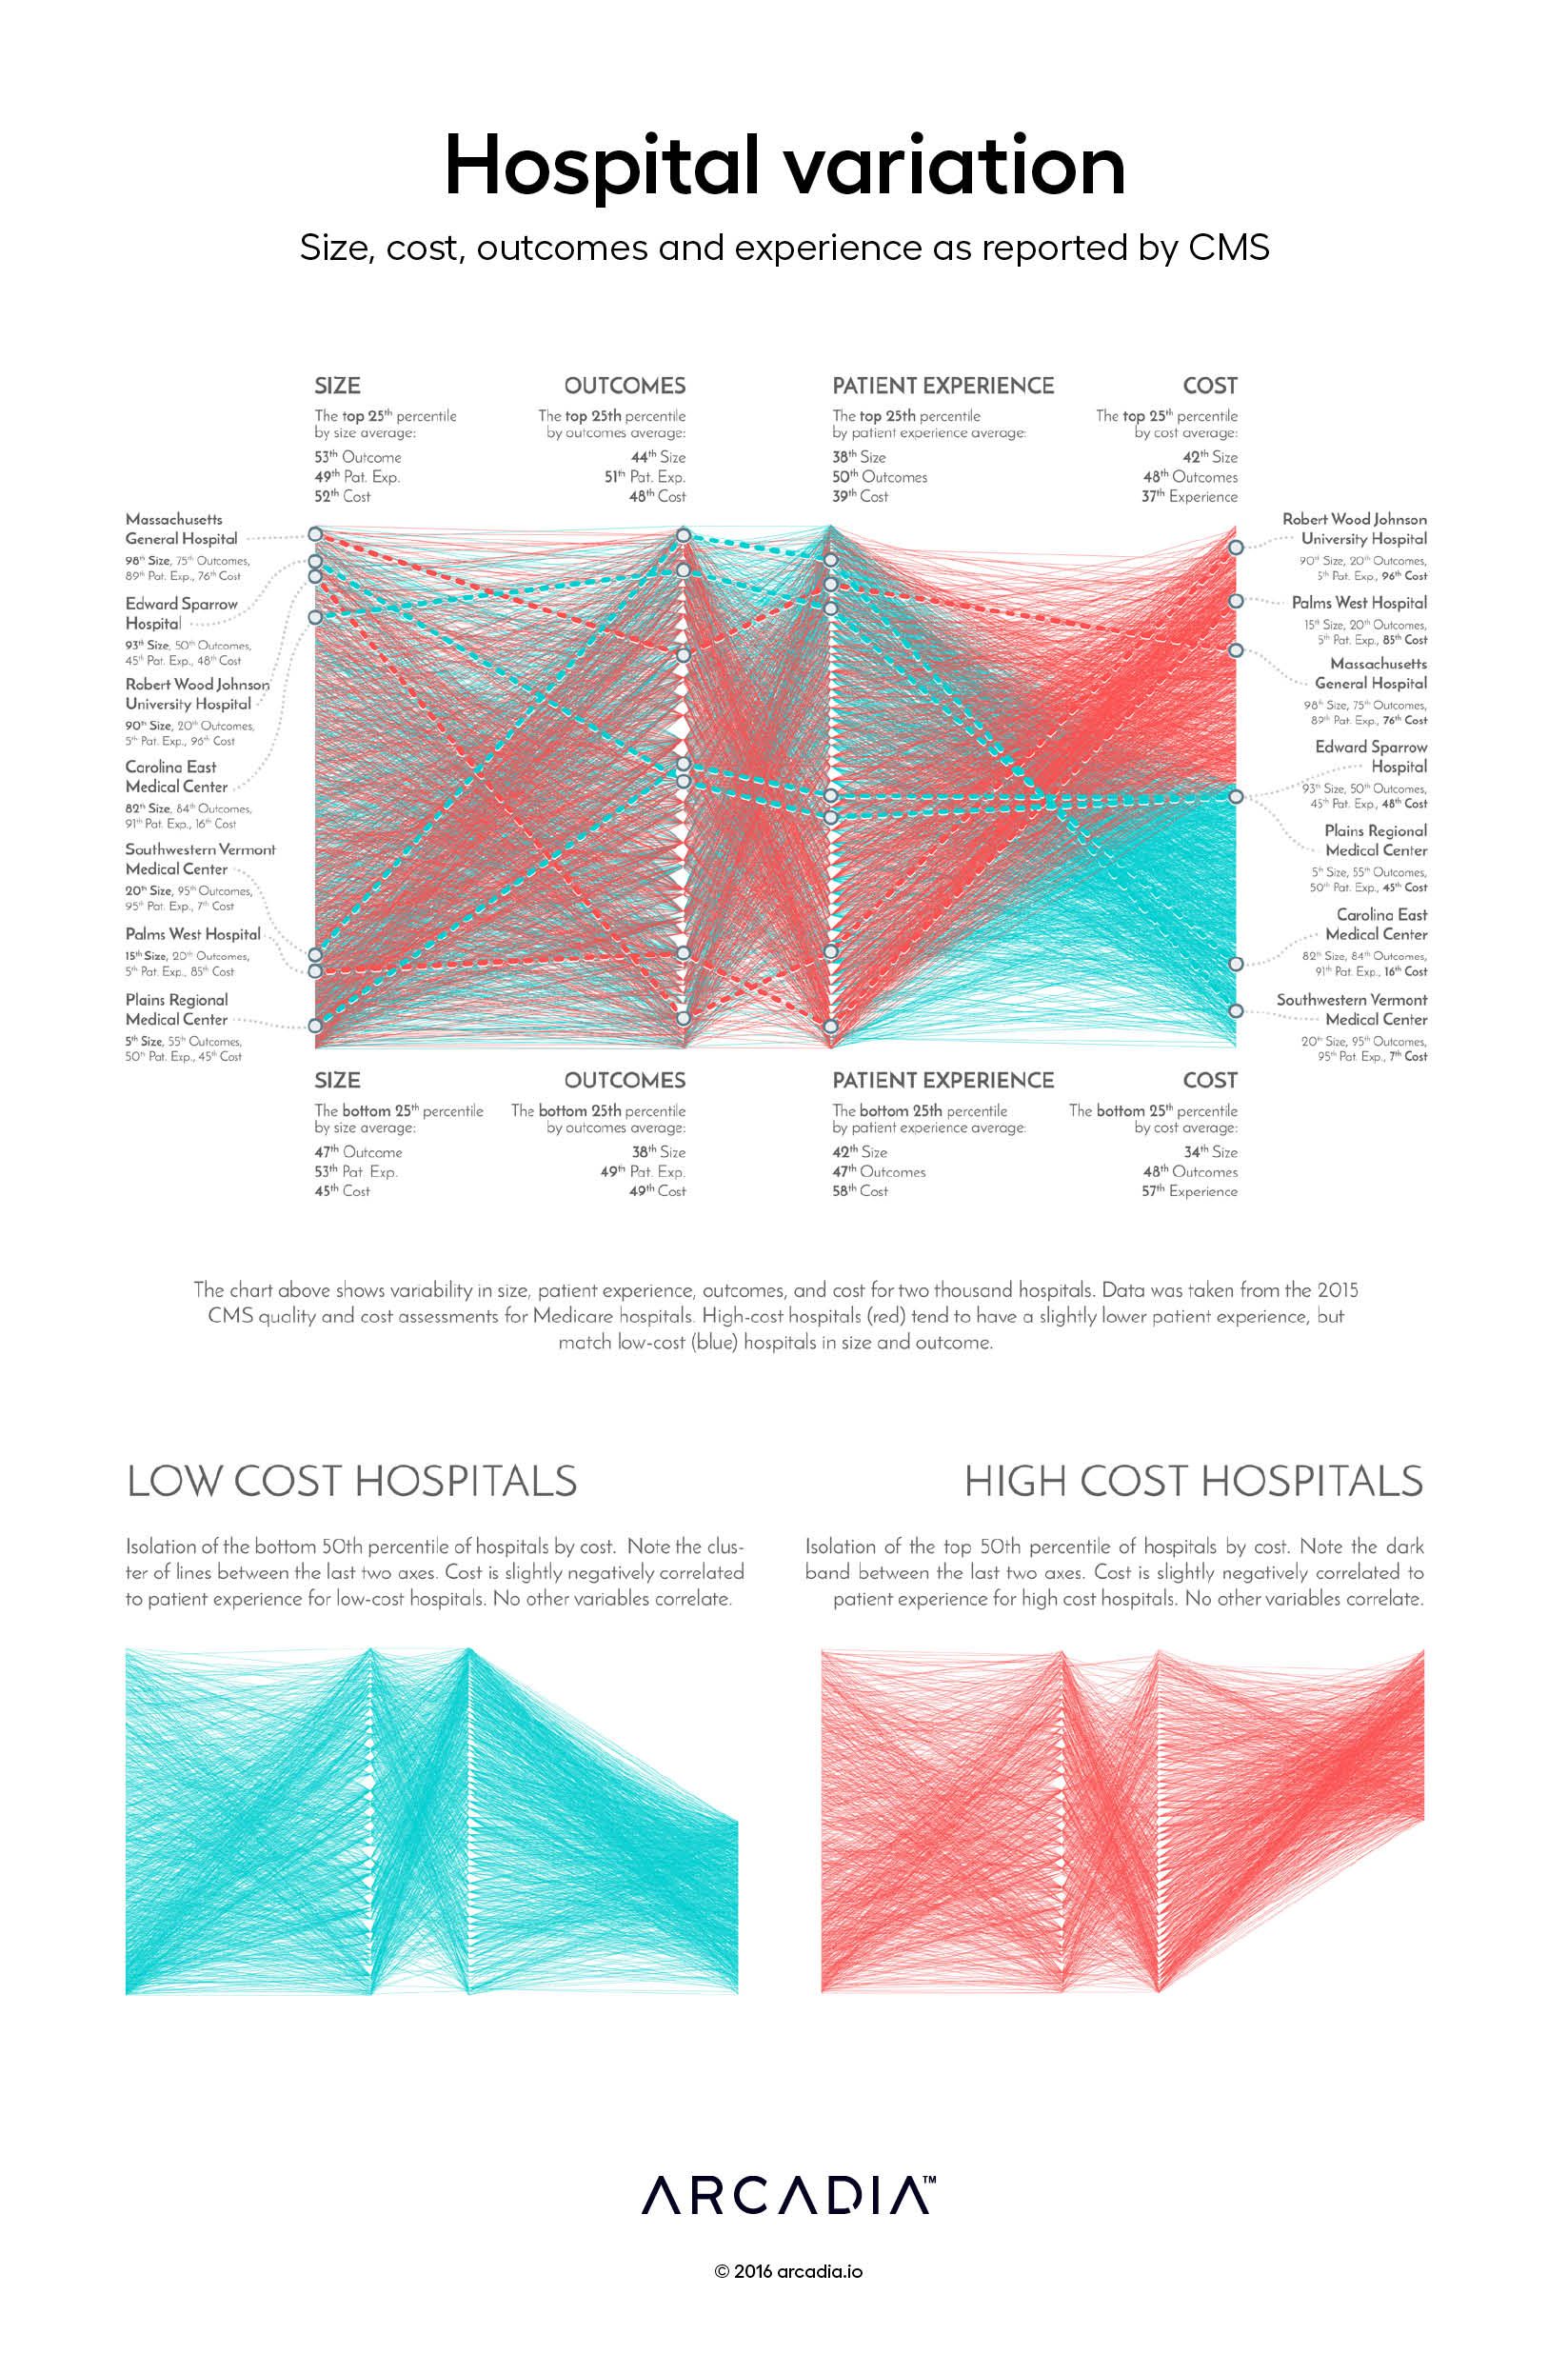
In this graphic, the artists took a macro view of billed costs, hospital size, quality outcomes, and patient experience. The information is laid out a like a loom, on which threads representing each hospital weave along a path based on those four key factors. Also referred to as a parallel coordinate chart, similar visualizations have been used to monitor air-traffic collisions and population shifts dating back to the 1880’s.
Each of the four axes represents a ranked distribution from the lowest to highest value of each of the metrics. The triangle-shaped gaps on the center axes are formed as each ‘thread’ bends around what would be a ‘reed’ in a real loom. The direction of the various threads indicate correlation between the four factors: a horizontal path indicates similarity between the concepts, while a strong positive or negative slope indicates variability between the factors. Color is used to further classify the hospitals based on their median performance, from blue (lowest cost) to red (highest cost).
SQL, R, D3.js SVG, with Illustrator.
Data sourced from CMS Quality and Cost Assessment for Medicare Hospitals.