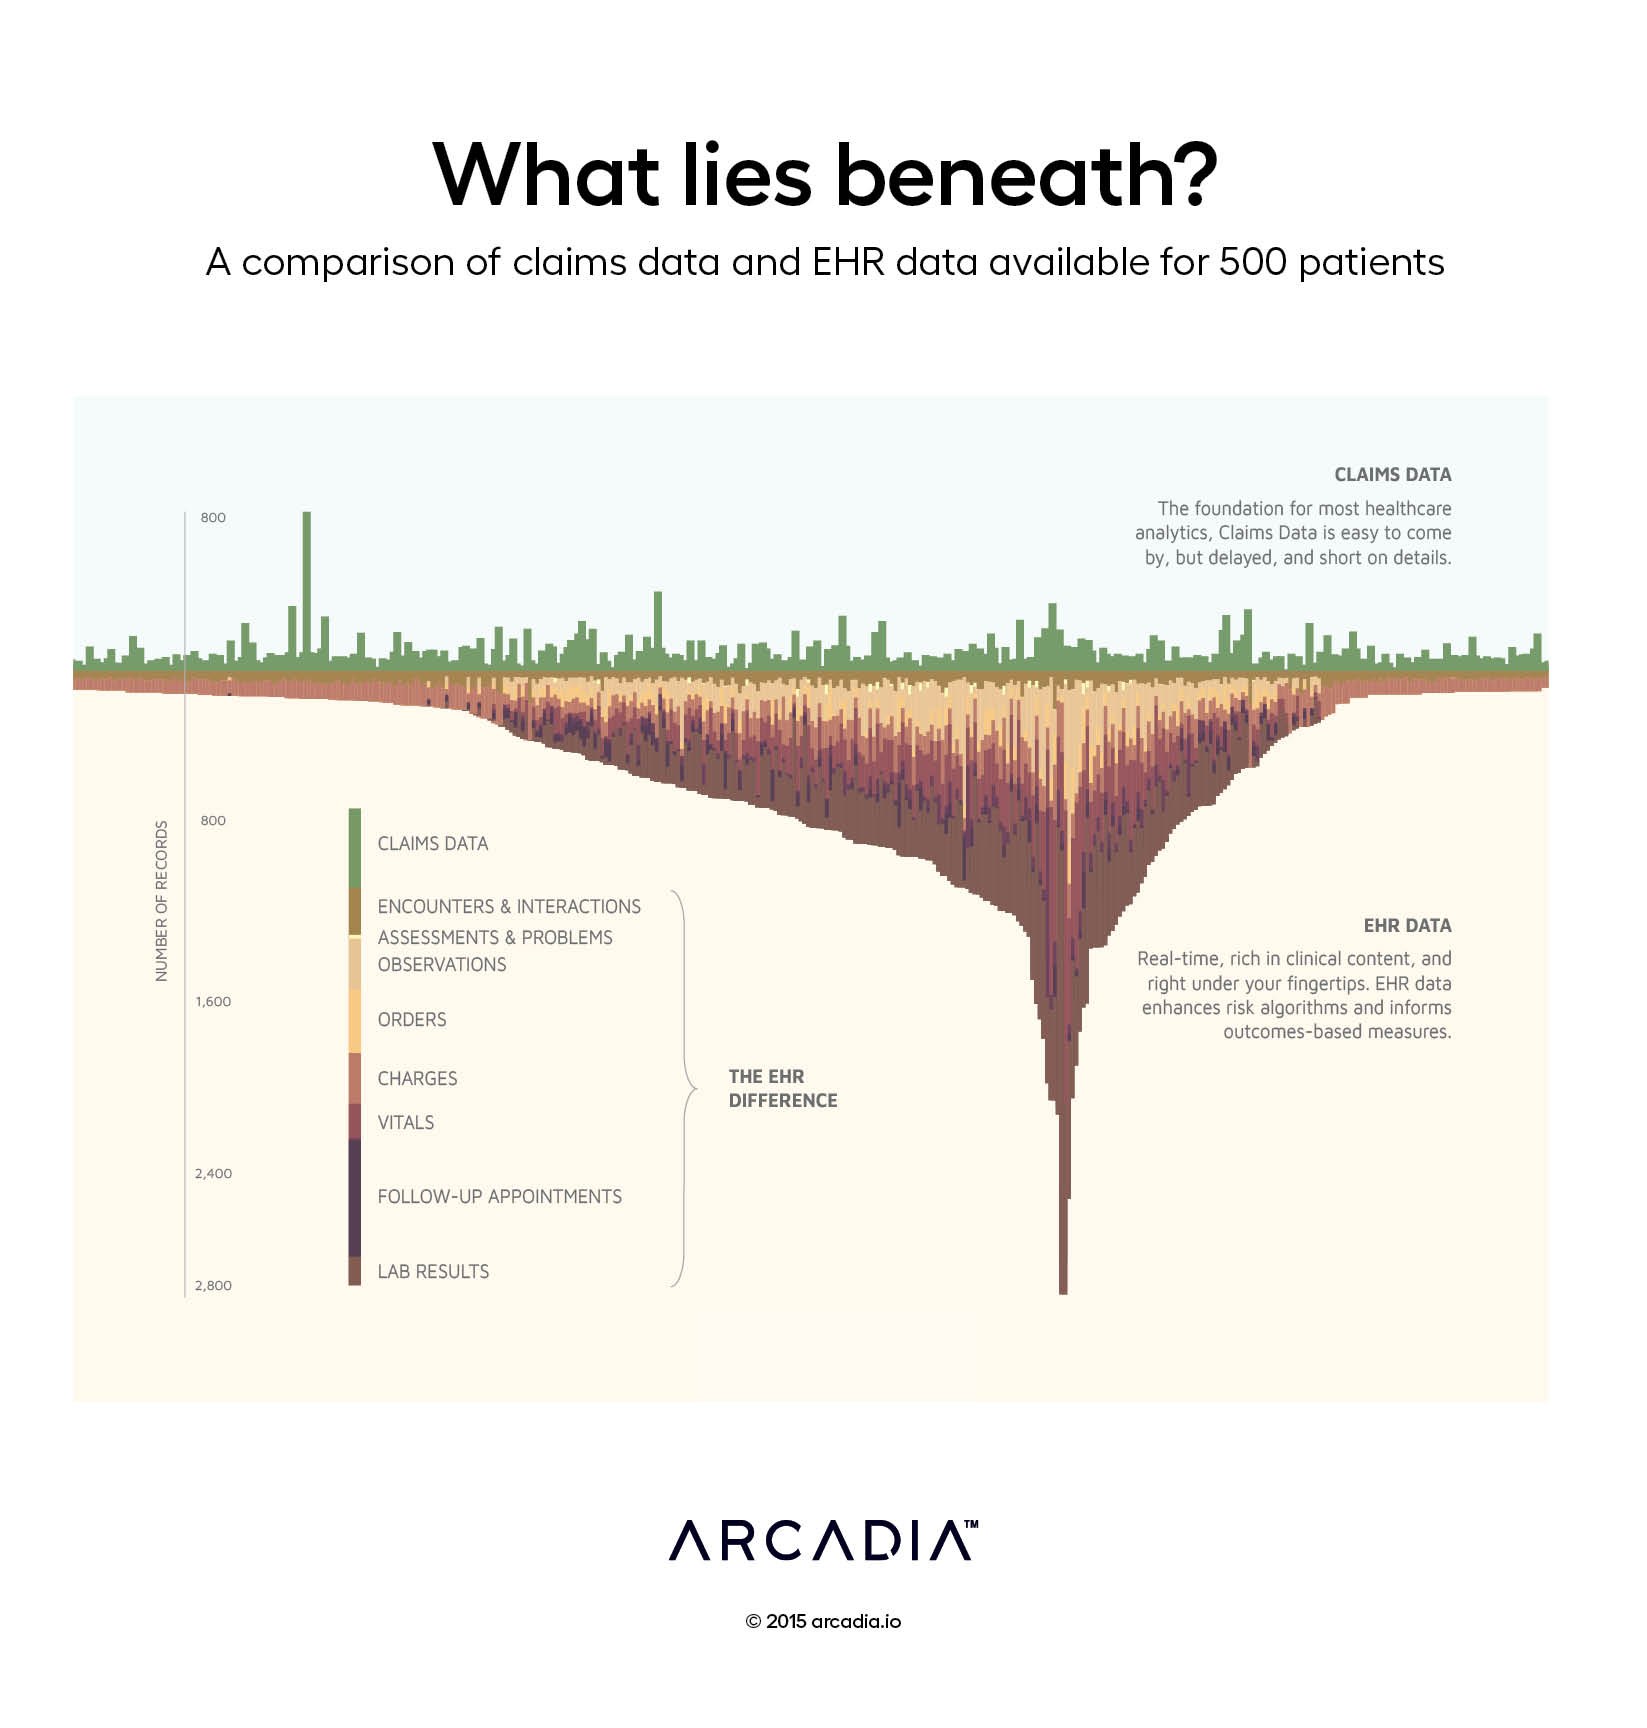
What lies beneath: A comparison of claims data and EHR data available for 500 patients

In healthcare analytics, claims data are ubiquitous. They have been available for decades and are highly structured and standardized. Unfortunately, they are also relatively sparse, containing only a handful of procedure codes and diagnoses for each episode. EHR data, on the other hand, carries hundreds of valuable data points for each encounter, including social indicators, medical history, lab results, vitals, point of care observations and more.
Because of its complexity, however, EHR data often goes underutilized (or unused entirely). It is a massive and rich dataset that lies just beneath a bed of the more familiar claims data, waiting to be explored for improved risk stratification and population health management.
This graph visualizes the quantity of data available for a set of 500 patients taken directly from Arcadia’s Benchmark Database. Claims records are represented by the green bars above the ground, dwarfed by the immense set of underlying EHR data, represented by the brown bars below ground.
By combining these two data assets into a unified data model, Arcadia is able to measure quality, track patient navigation and predict costs and events more accurately than even the most advanced analyses that rely on claims data alone.
Details
Excel-powered SVG visualization, with Illustrator
Data sourced from combined EHR and Claims data sources for 500 patients
