This site uses cookies that are essential for our site to work. We would also like to use non-essential cookies to help us improve your browsing experience and help make this website better, by collecting and reporting information on how you use our site.
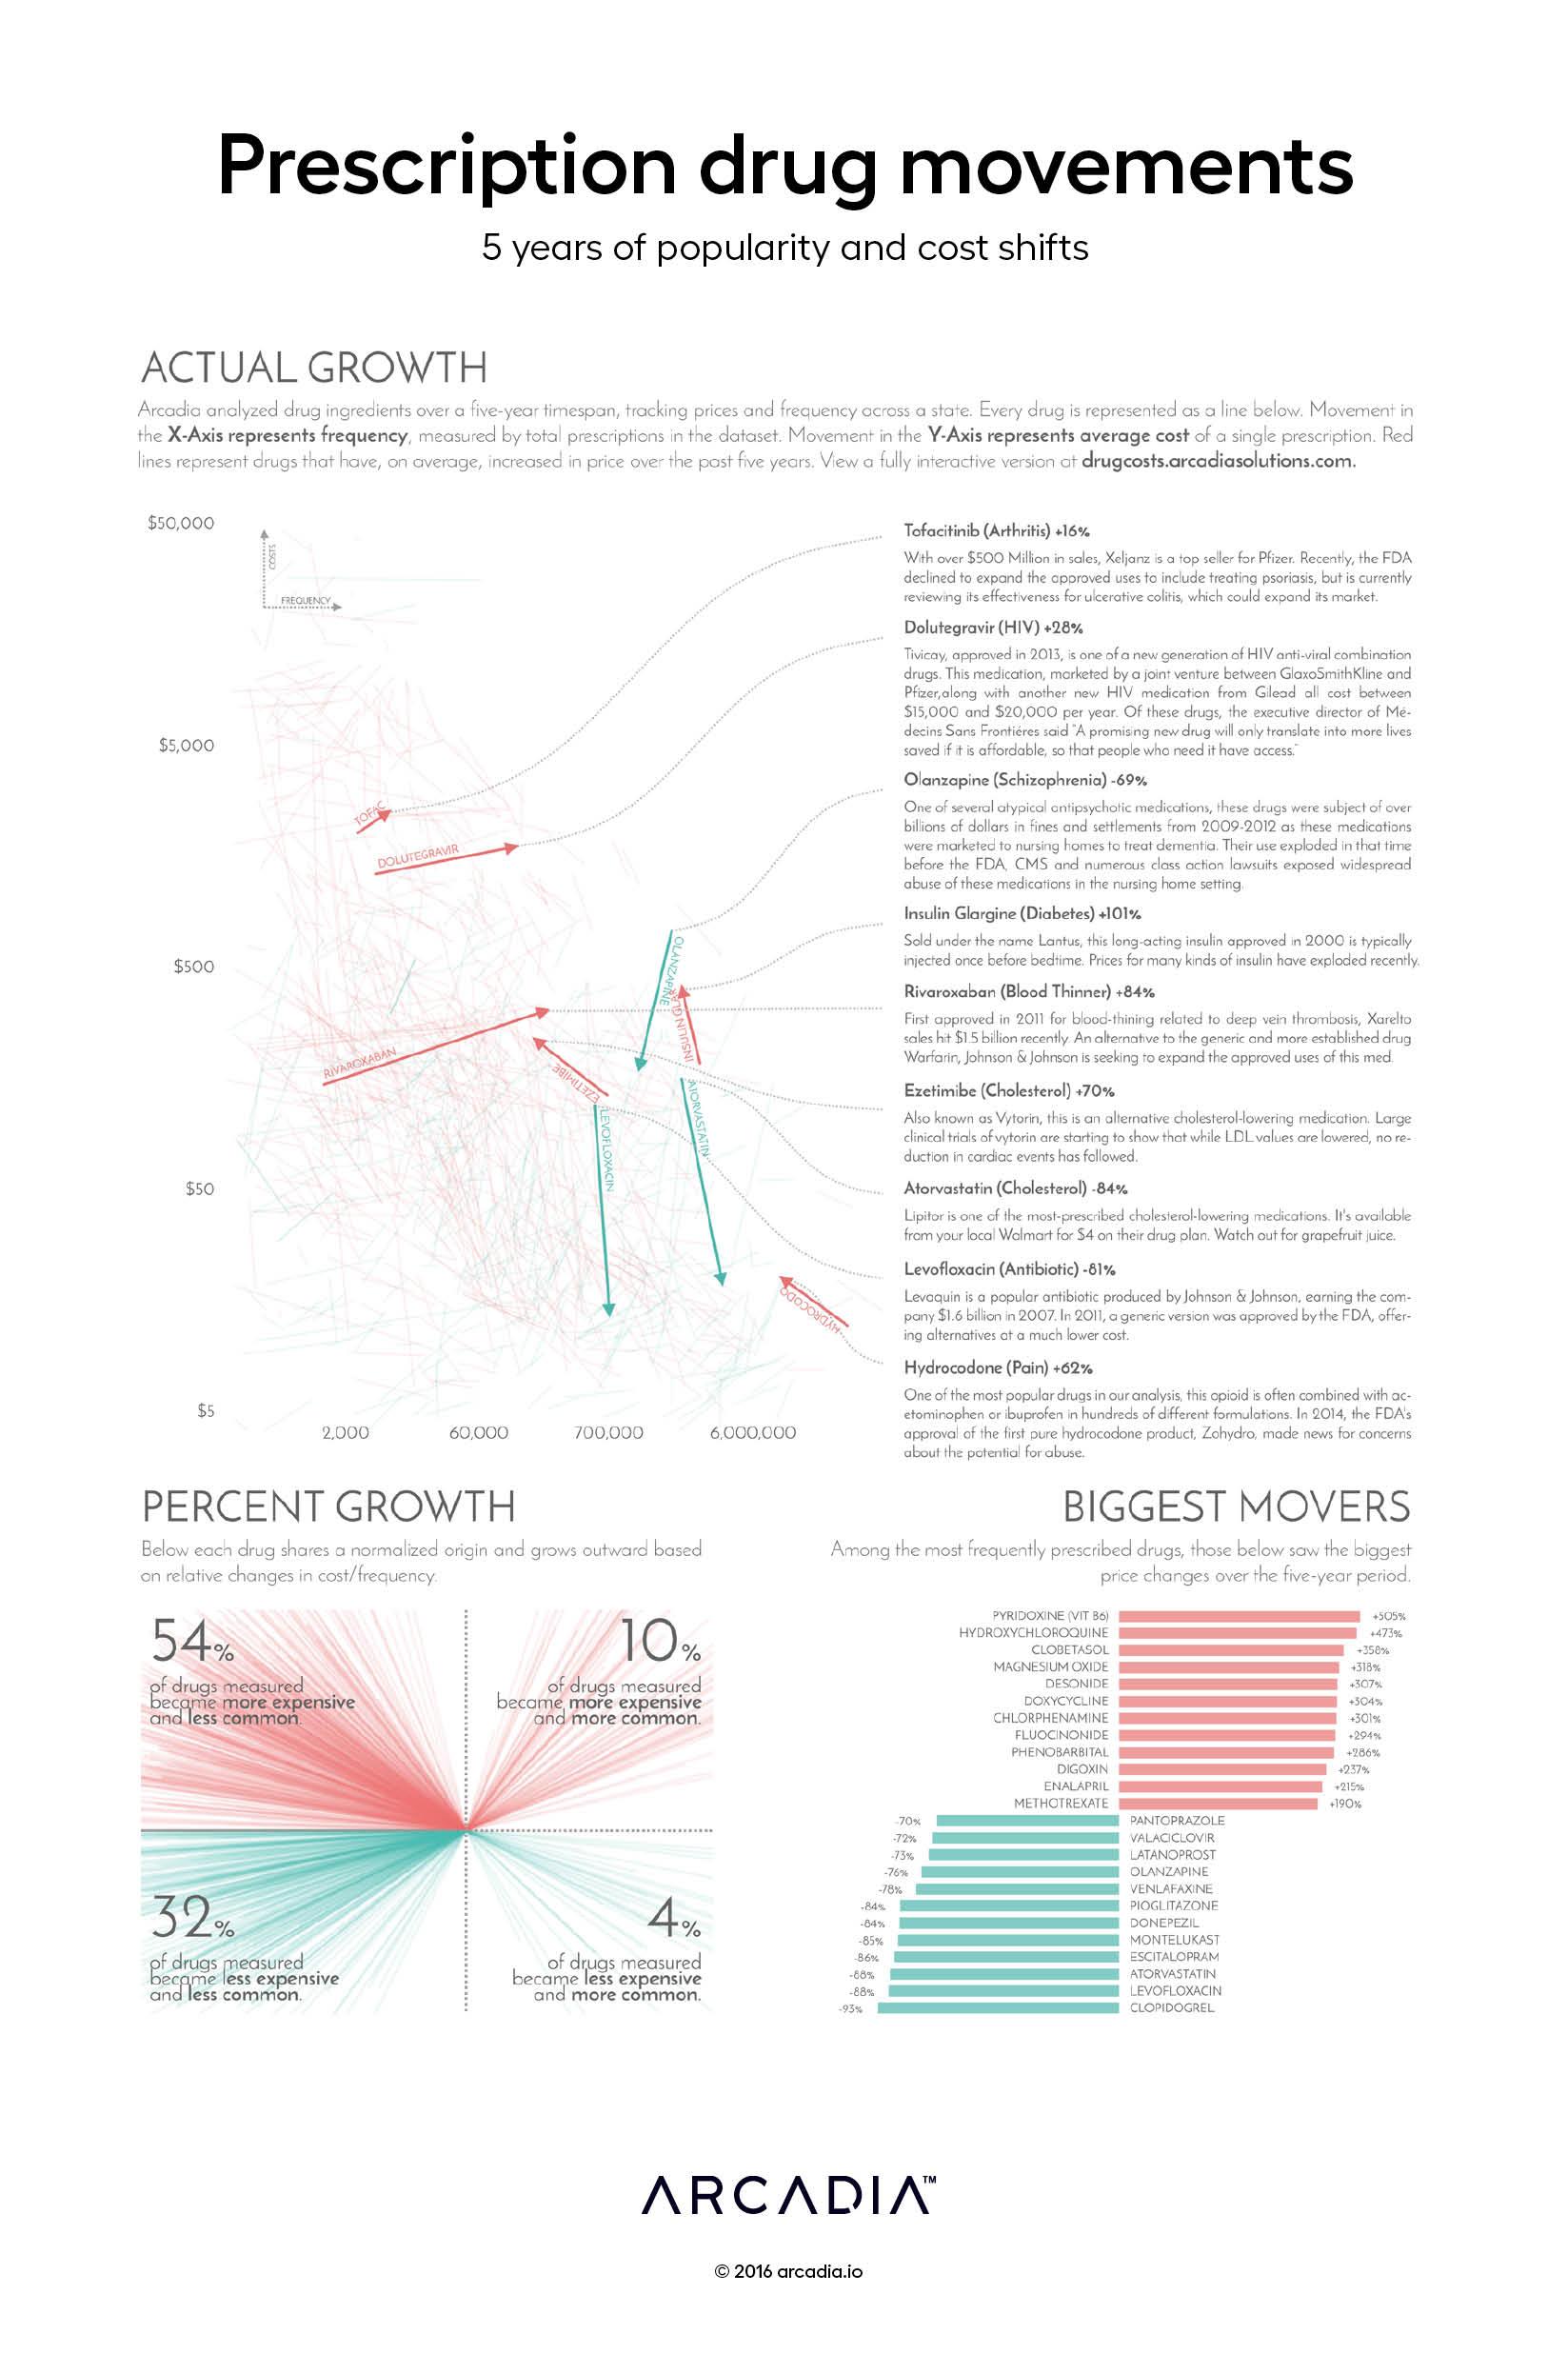
Data visualization showing changes in drug costs and prescription frequencies from 2011-2015 in one state.
As 2016 got underway, drug costs once again dominated the news, with several high-visibility shifts in prescription drug prices outraging patients, caregivers, and policy makers alike. Despite the publicity these dramatic shifts attracted, many other price changes occurred behind the scenes with little visibility or attention.
To try to shed some light on the problem, the artists normalized over 60,000 formulations of drugs by their active ingredient in an attempt to identify how much we pay for these treatments. The findings confirm numerous studies that show that overall spending on prescription drugs continues to outpace inflation.
Each line segment in this graph represents an individual drug ingredient, showing the shift in cost and utilization over time and telling an amazing story that ultimately touches many patients’ lives. Whether through increased competition driving a price downward, or a medical breakthrough driving usage up, this collage of changes represents thousands of stories about prescription drug use in our healthcare system.
The artists have highlighted just a few of these stories to the right of the figure. While it is clear that the vast majority of medications have risen in costs in the last five years, this figure also features a number of drugs with falling rates of utilization. This conclusion supports Center for Disease Control findings that found a leveling-off and even a reduction in prescription drug usage from 2005-2012.
Details
Python Jupyter, Google Datalab, D3.js SVG, with Illustrator. Data sourced from the National Average Drug Acquisition Cost program, and the Unified Medical Language System RxNorm Database.
Aggregate Training Day offers a customizable learning experience designed to meet you where you are — and take you further. Whether you’re diving into advanced platform capabilities or...
According to research from the CDC, approximately 129 million (nearly 40%) of people in the United States have at least one major chronic disease. Five of the top 10 leading causes of...
Whether operating under value-based care (VBC) contracts or traditional fee-for-service (FFS) models, improving care quality while managing costs is a major priority across the...