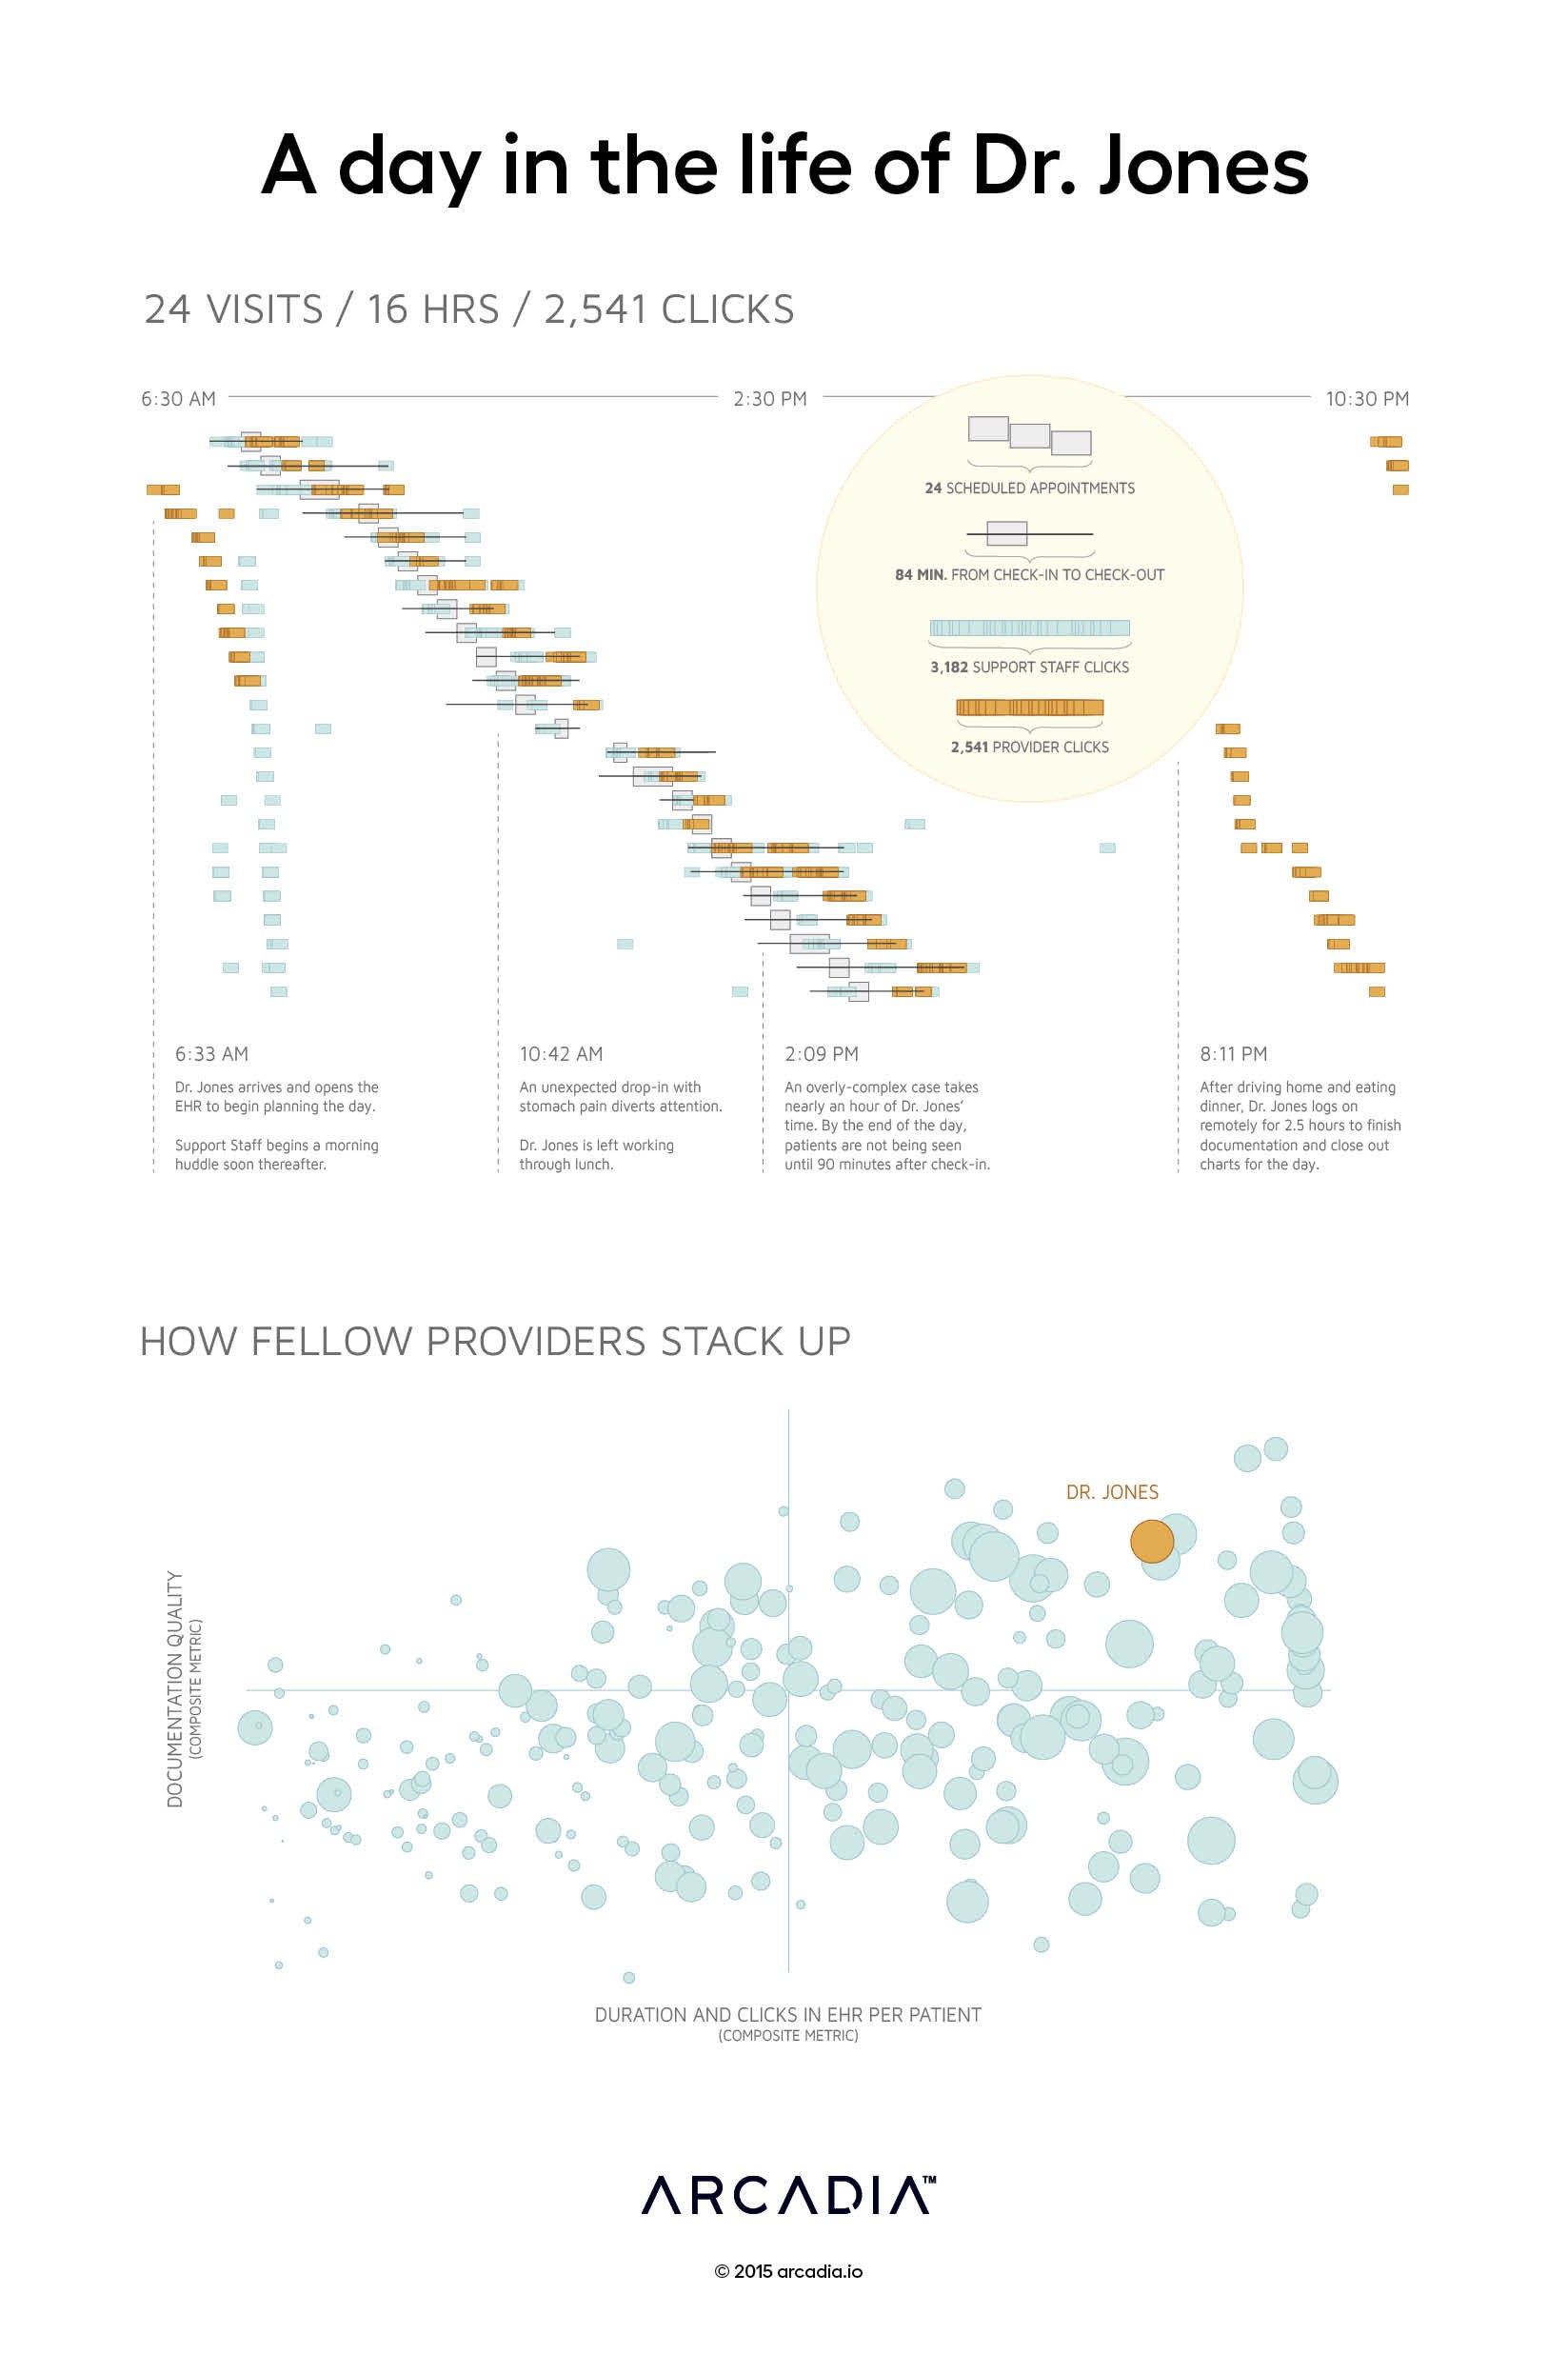
A day in the life of Dr. Jones: 24 visits, 16 hours, 2,541 clicks
Embedded deep within the EHR data that Arcadia mines for its customers is a highly detailed set of interactions between the provider, support staff, patients and the EHR software itself

Embedded deep within the EHR data that Arcadia mines for its customers is a highly detailed set of interactions between the provider, support staff, patients and the EHR software itself. Compiling each “click” within the system into a Gantt chart provides an intuitive summary of a day’s activities. Critical operational data like patient wait times, provider efficiency, documentation distribution and more emerge from thousands of minute interactions.
Arcadia uses various analyses in practice optimization engagements to identify opportunities to improve workflow or software configurations and enable high-quality documentation with fewer clicks and less time in the chart.
Explore a deeper analysis of this data visualization.
Details
D3.js SVG & NVD3, with Illustrator.
Data mined from 32 million EHR HIPAA audit log records.
