Webinar
Operationalizing LEAD: Network Benchmarking with Arcadia’s VBC Navigator solution
Learn about how Arcadia’s VBC Navigator solution can assist in making network decisions for LEAD participants.

The Centers for Medicare and Medicaid Services (CMS) report that in 2012, over 49 million individuals were covered by Medicare, at an average cost of $10,830 per beneficiary.
The total cost of health care services for any individual is influenced by many factors, including age, sex, and location. However, the presence of chronic conditions, such as diabetes, heart disease, and depression, has an overwhelming effect on the cost of care and utilization of healthcare services for individuals from all walks of life.
In 2013, CMS introduced their Chronic Conditions Data Warehouse to help document the prevalence and impact of chronic conditions on the cost of care in the Medicare program. The website serves as a data repository and also provides an interactive dashboard, offering varying levels of granularity for different types of users. Although all the data are focused on a specific group — Medicare beneficiaries — the concepts behind these data extend well beyond any one group.
For example, how do different chronic conditions, and combinations of conditions (or comorbidities), affect the cost of care across large populations?
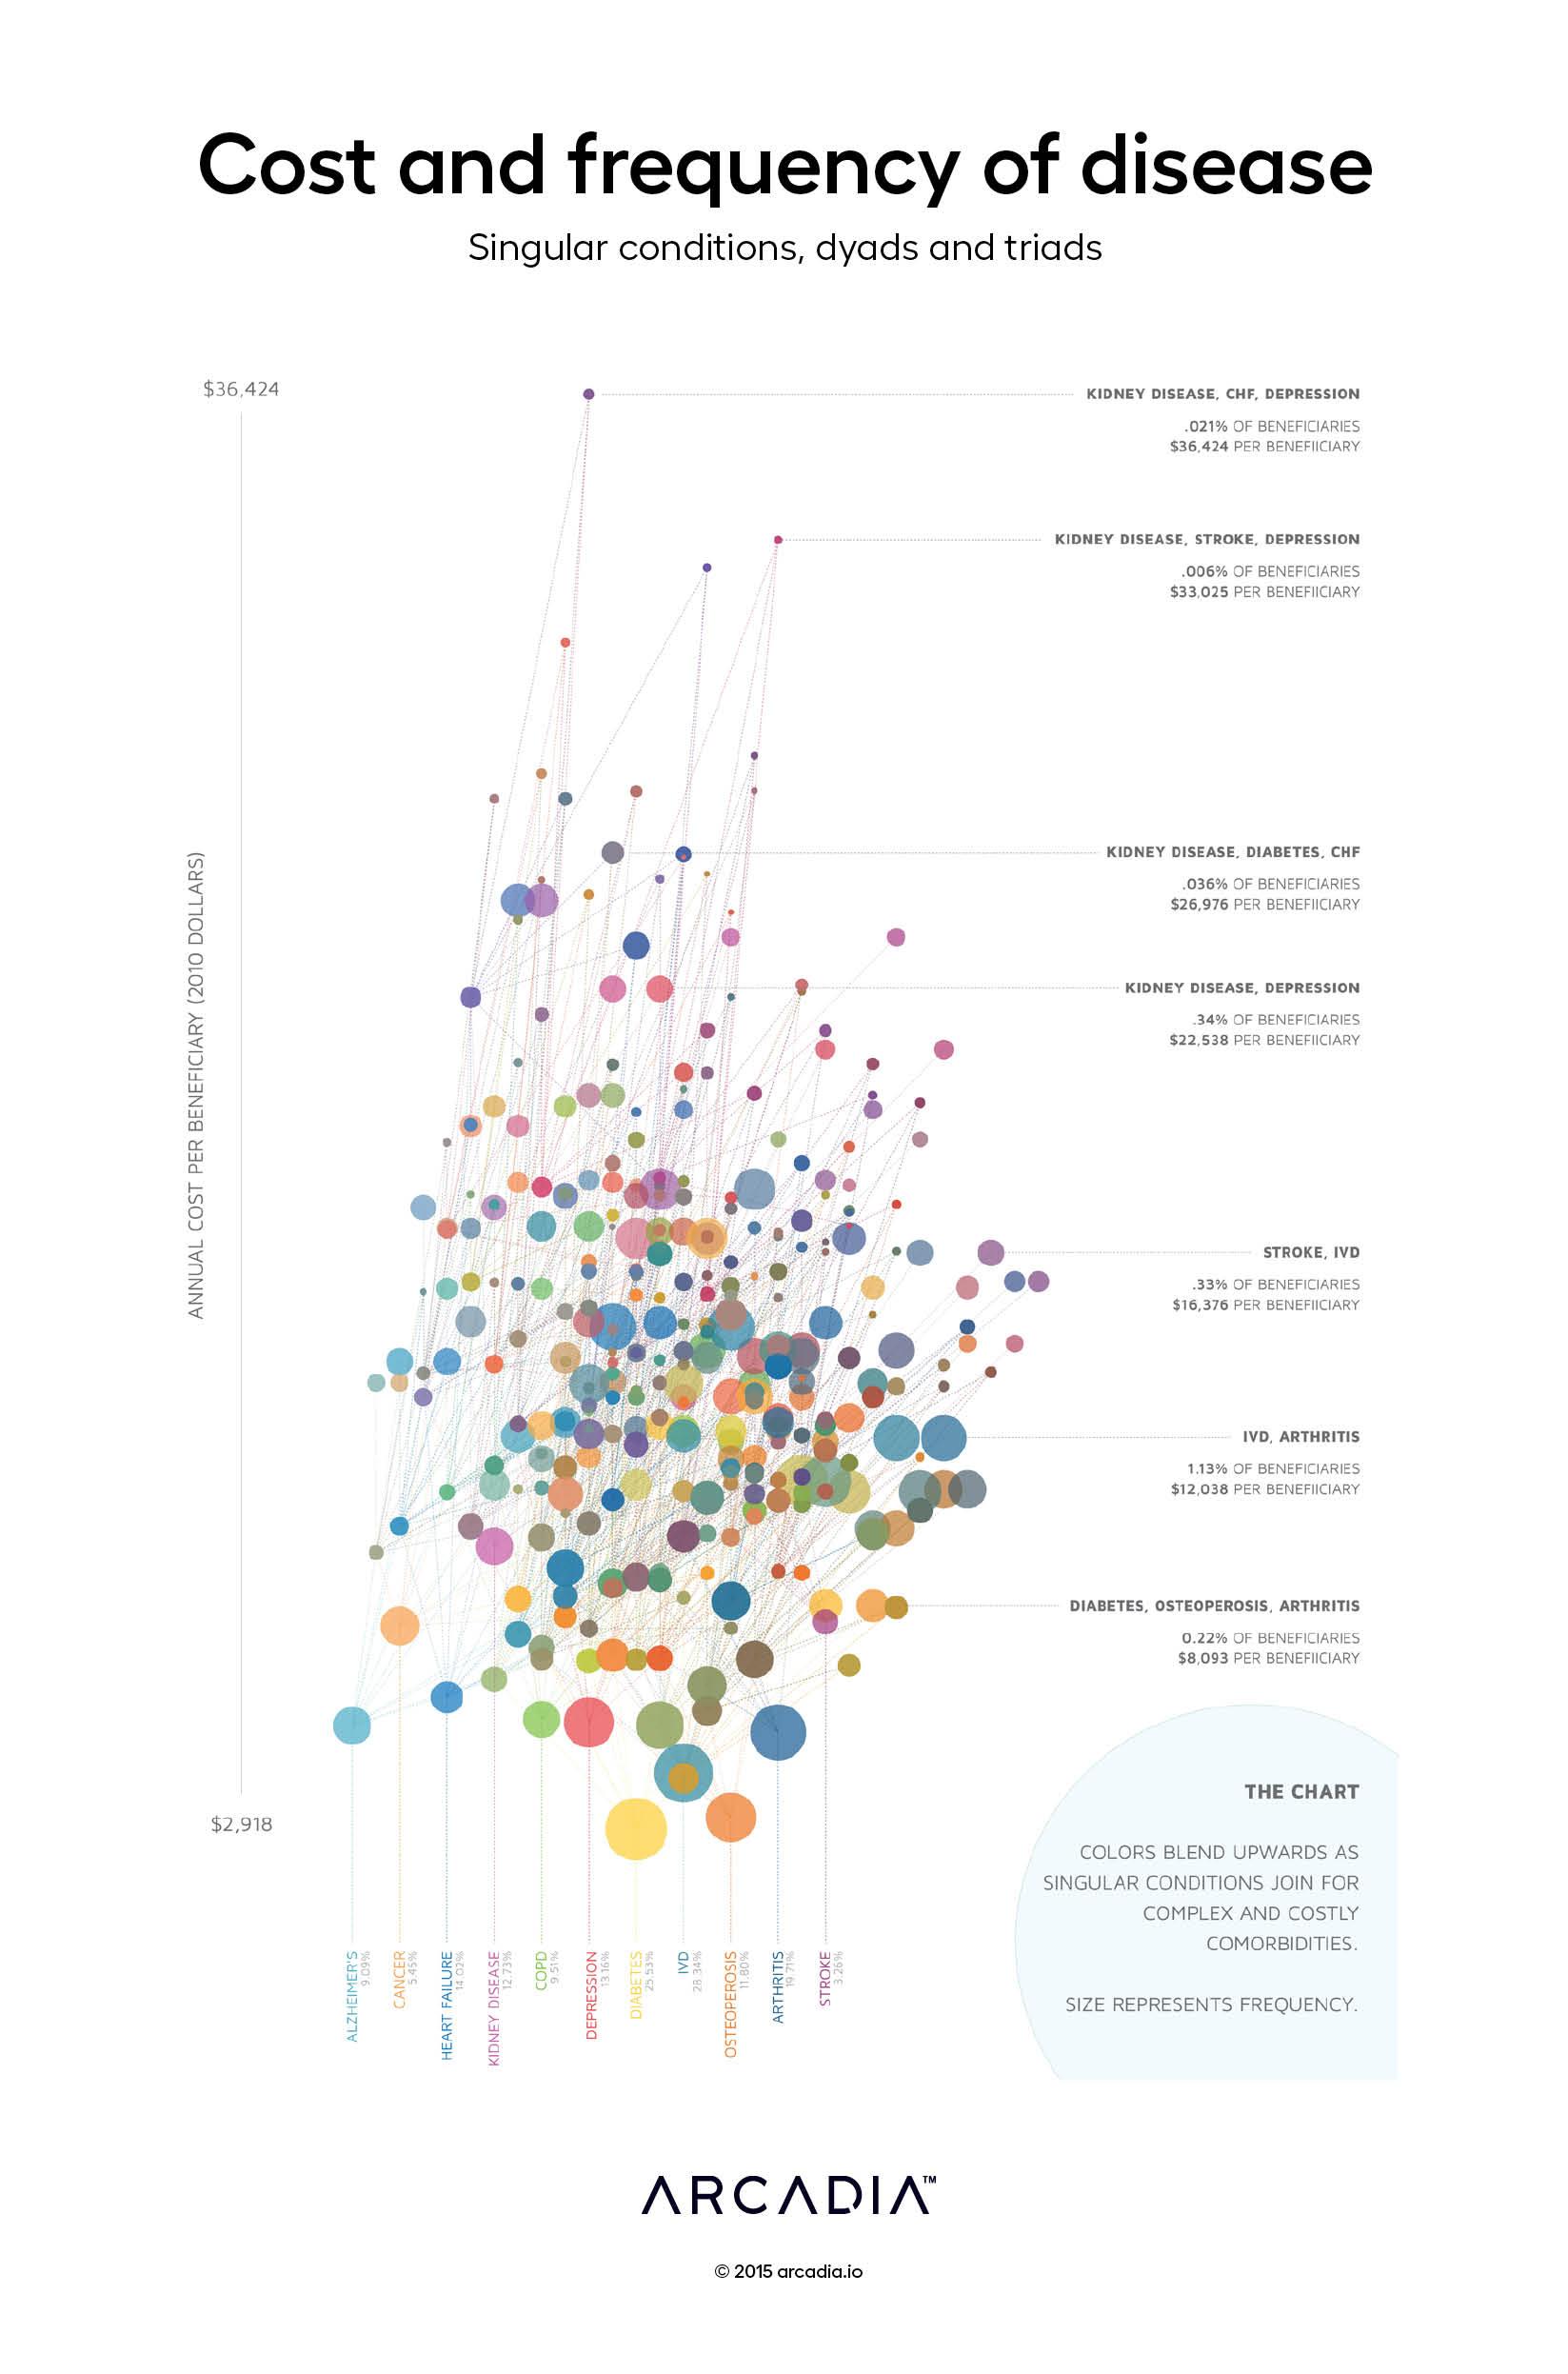
With this force-directed bubble plot, we have visualized the contents of the 2012 CMS Chronic Conditions Public Use File, which presents beneficiary counts and average Medicare payments by beneficiary sex, age range, and combination of eleven different chronic conditions: Alzheimer’s Disease and Senile Dementia, Cancer, Heart Failure, Chronic Kidney Disease, Chronic Obstructive Pulmonary Disease, Depression, Diabetes, Ischemic Heart Disease, Osteoporosis, Rheumatoid Arthritis and Osteoarthritis Arthritis, and Stroke and Transient Ischemic Attack.
Each bubble represents a cohort of beneficiaries with a specific combination of one, two, or three conditions. The size of each bubble represents the number of beneficiaries with that combination of conditions; the height represents the average annual cost of care for Medicare Part A and Part B services for year-round eligible beneficiaries. As one accumulates additional conditions, documented by lines drawn from the lower, less complex cases to the higher, more complex cases, we can see, in striking detail, the dramatic cost of comorbidities on patients and on the entire healthcare system.
D3.js SVG, with Illustrator.
Data extracted from 2012 CMS Chronic Conditions Public Use File