Joint replacement episode of care: Costs, pathways, and complications

Total joint replacements are the most common inpatient surgery for Medicare beneficiaries, yet there is high variance in cost and quality of care for these surgeries among providers. There is a huge opportunity to optimize care coordination and spending for better and more reproducible patient outcomes by leveraging a large, harmonized dataset.
In the CMS Comprehensive Care for Joint Replacement (CJR) model, an entire episode of care starting at the initial inpatient surgery and ending ninety days after discharge is bundled for payment and quality measurement. This bundled model incentivizes high-quality care coordination among facilities, physicians, and post-acute care providers.
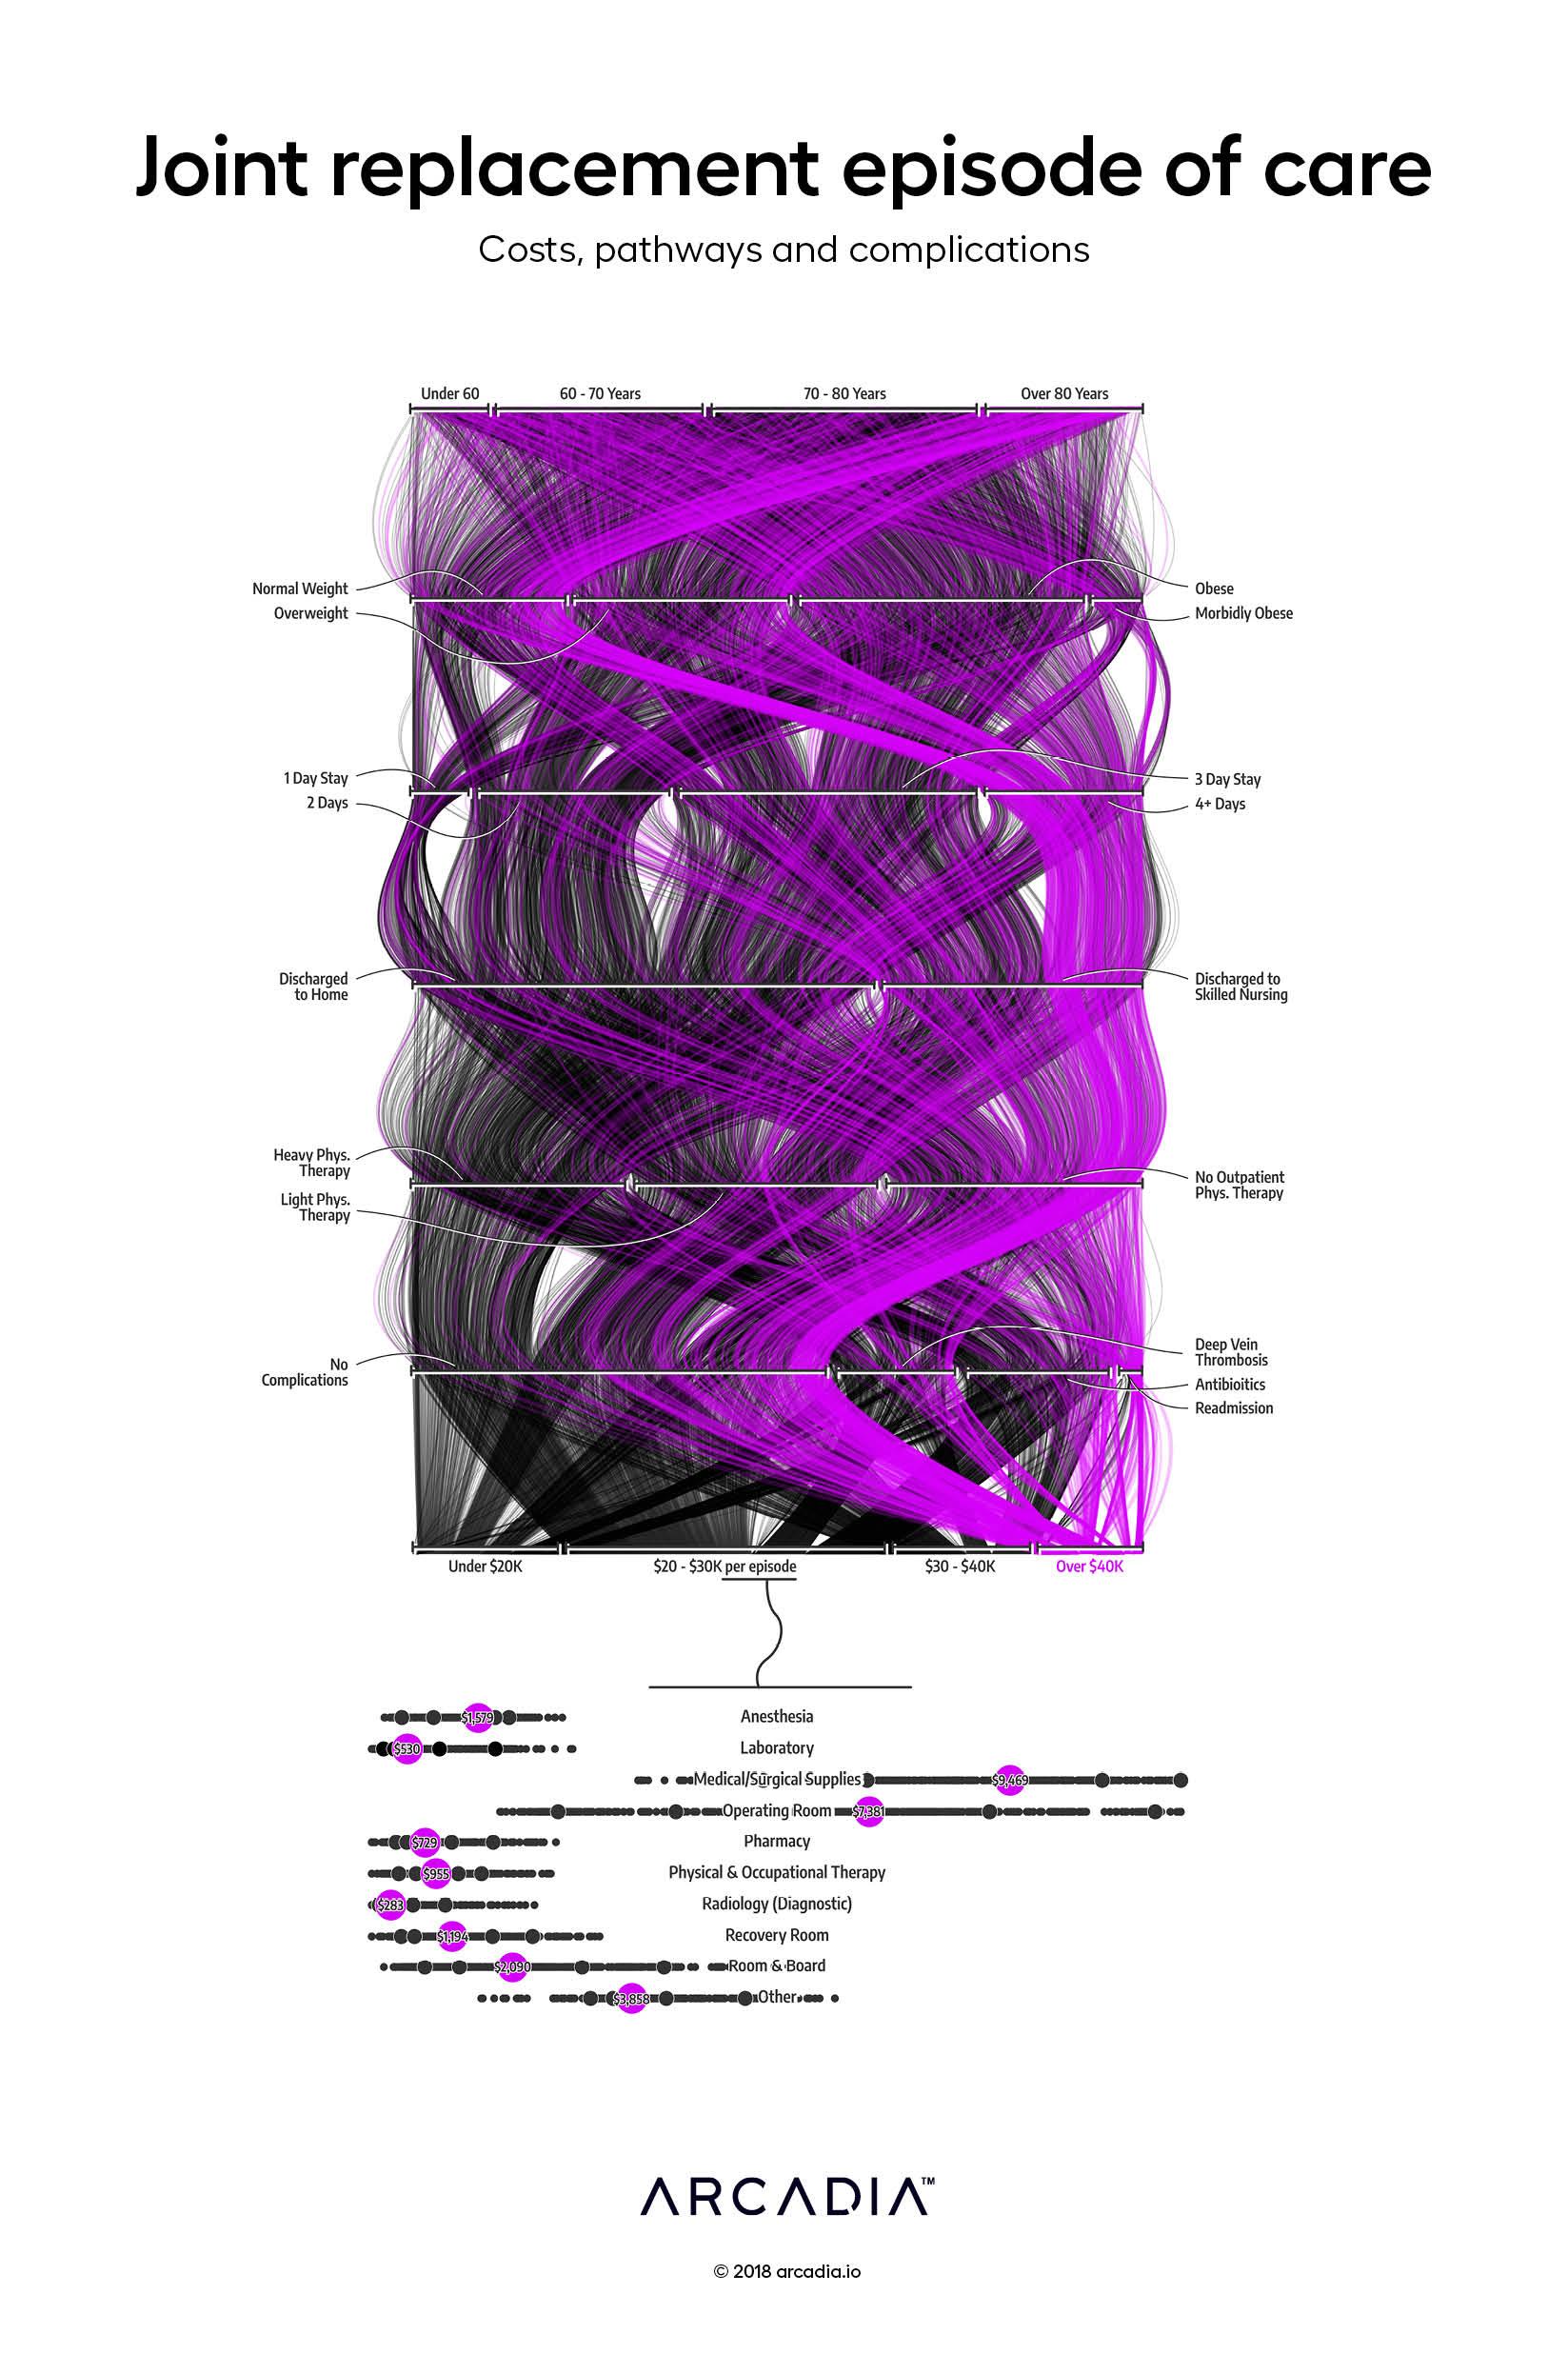
In this work, the artists weave a tapestry that examines the impact of factors such as BMI, age, and post-acute care on the outcome and total cost of a joint replacement episode. Each strand in the tapestry is an individual patient’s journey through a 180-day episode of care, threaded from top to bottom: from patient conditions at admission, through initial inpatient stay and discharge plan, to post-discharge complications and, finally, total episode cost. The visual combines concepts from a parallel coordinate chart, but through path clustering and interpolation creates a visual reminiscent of a Sankey chart from afar. By injecting dyes in certain types of thread (in this case — the purple applied to the costliest episodes) the reader can trace the events’ paths, much like a radiologist’s venogram.
The figure at the base of the piece further unpacks the costs of individual revenue categories within the inpatient stay. This figure displays the wide variance of costs for care and depicts the average cost of each category in each purple bubble. Medical/Surgical Supplies, for example, can vary from $3,000 to $20,000 depending on the implant the surgeon chooses.
Details
SQL, D3.js SVG, with Illustrator
Data sourced from Commercial and Medicare Advantage claims from Arcadia Benchmark Database
