Insight
AI-Inferred Risk Adjustment in LEAD: A Consequential Shift
CMS’ LEAD model signals a shift from HCC-based risk adjustment to AI-inferred scores, reshaping how patient risk is measured and paid.

Editor’s note: This is the third article in a series about CMS’ new LEAD model. Article one explored the new model in broad strokes. Article two discussed AI-Inferred Risk Adjustment. Future posts will explore CMS-administered risk arrangements and beneficiary enhancements.
LEAD, CMS’ ten-year bet on accountable care, replaces ACO REACH, a model planned to sunset on December 31, 2026. Participants will need to decide their path forward, which includes whether to enroll in MSSP or convert to LEAD. A deciding factor will be whether the math works, and benchmarking will be critical in answering that question.
LEAD does not treat all Medicare beneficiaries the same way for benchmarking purposes. It splits them into three populations: 1) aged and disabled (A&D); 2) end-stage renal disease (ESRD); 3) a new category called High Needs. Each population segment will have its own specific benchmark.
The model’s design then applies a set of ACO-specific adjustments that are intended to reward efficient organizations, give high-spending organizations a realistic on-ramp, and recognize historical savings. These adjustments differ depending on your history with shared savings models, and those organizations coming from MSSP may be at a structural disadvantage compared to organizations coming from REACH or newly entering into CMS value-based care programs.
In MSSP, an ACO’s benchmark is its benchmark. All of their aligned beneficiaries, regardless of clinical complexity, are pooled together. The risk adjustment model (CMS-HCC v28) does its best to account for differences in expected cost, but the fundamental unit of analysis is the ACO’s total aligned population treated as a single group.
LEAD breaks this apart. Every aligned beneficiary is categorized into one of three populations: Aged and Disabled (A&D), ESRD, or High Needs. Each population gets its own benchmark, its own risk adjustment model, and its own risk score growth caps. The ACO’s financial performance is calculated separately for each population and then combined at reconciliation.
This matters more than it might seem.
Consider an ACO with 10,000 aligned beneficiaries, 8,000 of whom are relatively healthy A&D, 500 with ESRD, and 1,500 who meet the High Needs criteria. In MSSP, the ACO’s spending on those 1,500 complex patients is averaged into its overall cost performance. If those patients had an expensive year—more hospitalizations, more skilled nursing days, more emergency utilization—it drags down the ACO’s performance across the board, even if the ACO managed its A&D population exceptionally well.
The 8,000 healthy patients subsidize the math for the 1,500 sick ones, or vice versa. Without doing the disaggregation yourself, it’s very difficult to render granular specificity.
Risk scoring is supposed to help with this problem. But according to a 2021 report to Congress on risk adjustment, the current HCC-based risk adjustment system under-predicts costs for the high needs population.
LEAD eliminates this cross-subsidy. If an ACO’s A&D population came in under benchmark, but their High Needs population did not, the ACO’s financial results will reflect both outcomes independently.
It’s not possible to hide a poorly managed complex population behind strong performance on healthier patients. Equally important, there is no penalty on a complex population with volatility that the benchmark wasn’t designed to absorb.
The risk adjustment models are different for each population, too. A&D uses a modified prospective model (CMMI HCC Prospective V1, based on CMS-HCC v28). ESRD uses the 2023 CMS-HCC ESRD model. And High Needs uses a concurrent model (CMMI HCC Concurrent V2) that scores patients based on diagnoses in the current year, not just the prior year.
Concurrent scoring is important because prospective models systematically under-predict costs for patients whose conditions are deteriorating, and last year’s diagnoses do not capture this year’s clinical reality. Concurrent scoring fixes that lag.
The LEAD RFA specifies seven criteria for High Needs designation. A beneficiary who meets any one of them is classified as High Needs, and that classification is permanent for the duration of the model. Once a patient is designated as High Needs, they remain so until the end of the LEAD model. No annual re-evaluation. No risk of patients cycling in and out of the category.
The seven criteria include mobility impairment (defined by specific ICD-10 diagnostic categories — cerebral palsy, spinal cord injury, multiple sclerosis, muscular dystrophy, and several others), frailty (measured by the Kim Claims-based Frailty Index, with a threshold of 0.35 or higher), high risk scores (3.0 or above for A&D, or 0.35 or above for ESRD), two or more unplanned inpatient admissions combined with a risk score between 2.0 and 3.0, and extended skilled nursing facility stays of 45 days or more.
The permanence of the designation is worth lingering on. In most programs, a patient’s risk category can change year to year. In LEAD, once a beneficiary crosses any of the seven thresholds, the ACO receives the benefit of the separate benchmark and concurrent risk model for that patient for the remainder of the model.
This creates planning stability that does not exist in MSSP. An ACO building a care management program around their most complex patients knows that those patients will remain in the High Needs category and will continue to be benchmarked and risk-adjusted accordingly. In other words, an ACO is not building a program that could lose its economic justification because patients’ codes have changed.
For ACOs where at least 40% of aligned beneficiaries are designated High Needs, the alignment minimum drops to 800. The standard minimum is 5,000. This is CMS explicitly inviting PACE-like programs, safety-net systems, and organizations serving predominantly complex populations into a model that was designed with their patient mix in mind. MSSP has no equivalent. If an ACO serves a population that is 60% High Needs and cannot reach 5,000 aligned beneficiaries, MSSP is not available. LEAD is.
After the baseline is set and trended forward, LEAD applies a series of ACO-specific adjustments to the benchmark. These are the levers CMS is using to make the model work for different types of organizations. Understanding them is essential to compare LEAD to MSSP for a specific ACO.
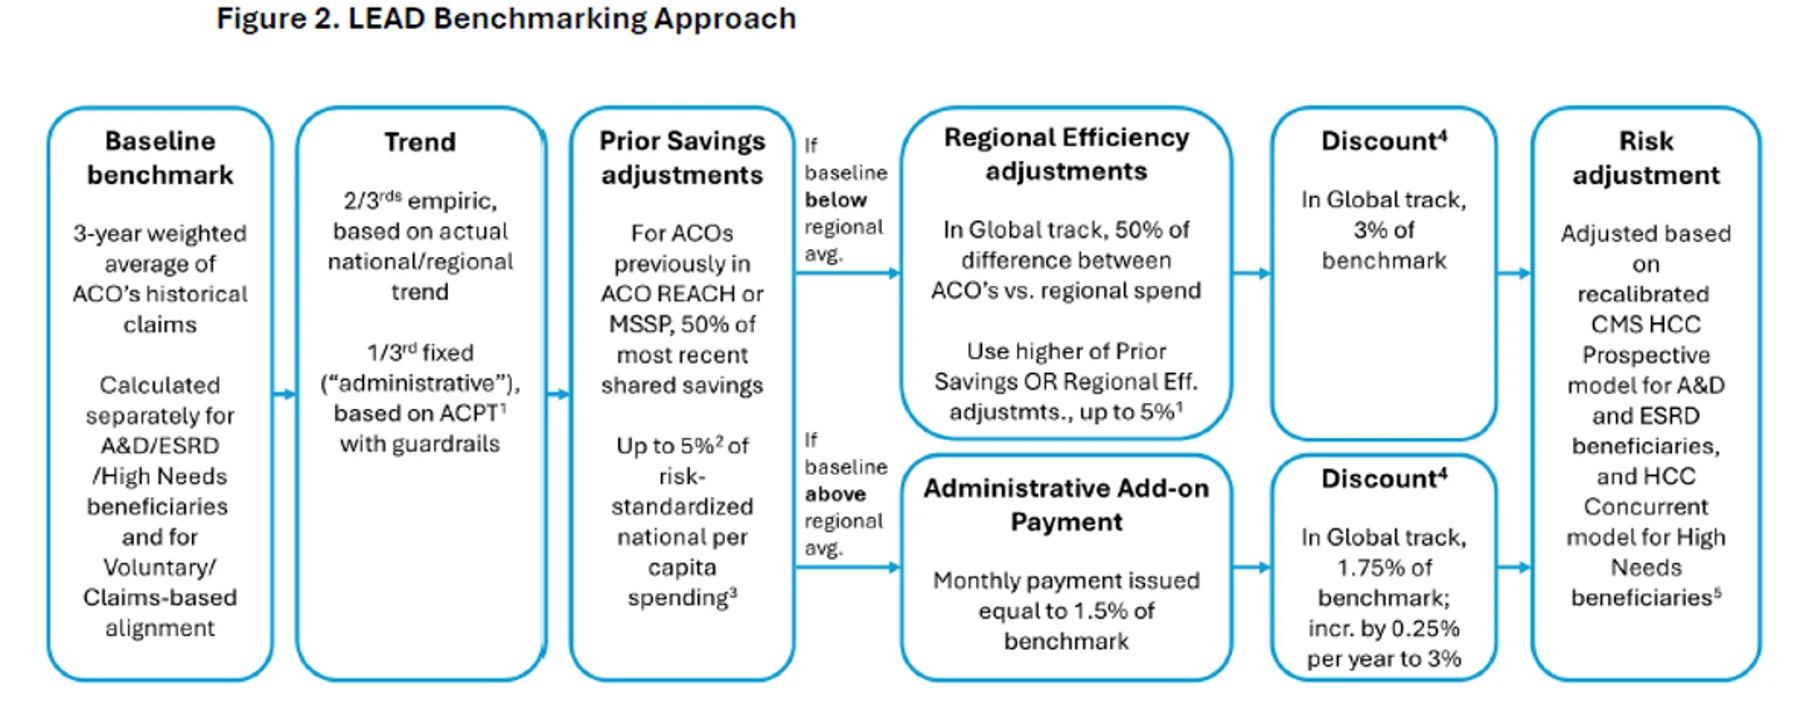
If an ACO’s historical spending is lower than the regional average, it is eligible for an upward adjustment equal to 50% of the efficiency gap. This is straightforward: if the ACO’s region averages $12,000 per beneficiary and it averaged $11,000, the gap is $1,000, and the benchmark gets bumped up by $500 per beneficiary.
MSSP has a similar mechanism in the Positive Regional Adjustment, introduced for agreement periods beginning January 1, 2025. The concept is the same: reward ACOs that are already more efficient than their region so they aren’t penalized for having a low spending baseline.
Renewing ACOs can also receive credit for savings generated in the three calendar years immediately before LEAD begins. CMS compares each year’s benchmark expenditures with actual spending, divides by aligned beneficiary months, averages the three years, and applies a proration factor to account for changes in population size. The final adjustment is 50% of that prorated average per-capita savings amount.
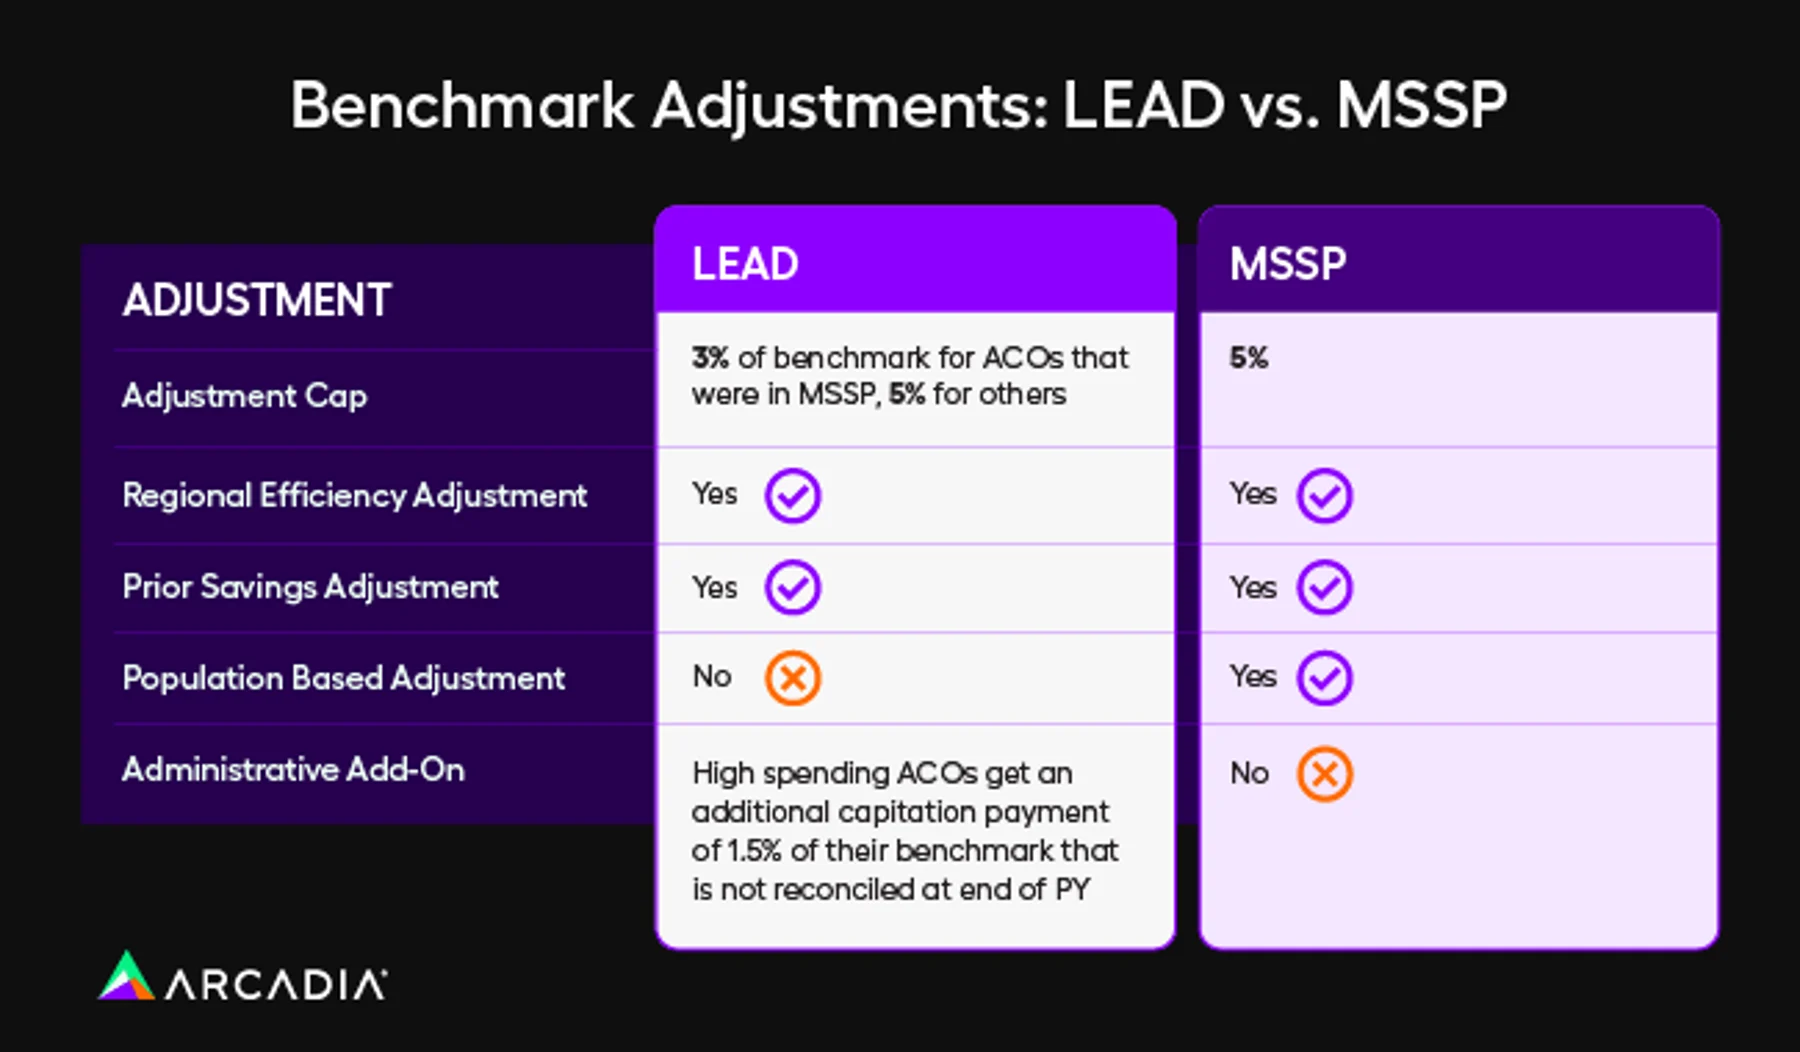
An ACO cannot receive both the Regional Efficiency adjustment and the Prior Savings adjustment. It gets whichever is higher, subject to a cap. The cap is 3% of the benchmark for ACOs with more than 40% of Participant TINs that previously participated in MSSP, and 5% for everyone else.
This is an important distinction that could impact an organization’s decision on whether to participate in LEAD or MSSP. An ACO coming from MSSP gets a 3% cap. All other ACOs, including former REACH ACOs, are capped at 5%.

Higher-spending ACOs, which are simply those ACOs with historical costs above the regional average, receive a 1.5% administrative add-on. This is a monthly, capitated payment. It is not included in the total cost of care calculation at reconciliation and is not subject to repayment. Functionally, it’s a grant to help higher-spending organizations build the infrastructure needed to reduce costs.
This is one of the more interesting design choices in LEAD. CMS is acknowledging something that everyone in value-based care knows, but that program design rarely addresses: it costs money to save money. Building a care management program, hiring nurse navigators, investing in data analytics, and setting up transition-of-care workflows all require upfront investment. That investment is hardest for organizations already spending above the regional average, because those are the organizations with the tightest margins.
MSSP has no equivalent. ACOs entering MSSP as high-spending receive a benchmark based on their own (high) historical spending blended with regional averages. Typically, the blend pulls that ACO’s benchmark down toward the regional mean. It gets no additional investment capital to bridge the gap.
LEAD does not eliminate the challenge of being a high spender. The discount still applies, and the risk is still real. However, the administrative add-on explicitly recognizes that these organizations need startup capital to succeed.
In our next post, we will shift from benchmarking to CMS-Administered Risk Arrangements, or CARA. It’s about how ACOs can extend risk arrangements to the specialists they work with. For organizations that have spent years building episode analytics, CARA is where that work becomes directly relevant to model participation.