Insight
Healthcare Access and Equity: Addressing Barriers to Care
Healthcare access and equity are critical concepts to understand for a healthier overall society. Learn more about them and how you can help in this guide.

When she’s not combing through customer data to tease out meaningful insights, Arcadia Senior Reporting Analyst Maddie Rouhana can be found volunteering at a local hospital. That’s where she overheard nurses describing their observed discrepancies in medication prescription based on gender.
“People began discussing that they often see women getting prescribed medications at much higher rates than men, and I was curious to see if we would be able to see that across customers,” Rouhana said. “So I figured it'd be cool to use Arcadia’s database and see if that was prevalent across the populations we're looking at.”
Below, we’ll dig into the results of her research, which revealed fascinating trends around prescription patterns and demographics that point to larger healthcare questions.
Undertaking this investigation required some methodology and parameters, so to start, Rouhana narrowed the prescription data she was sifting through to October through December of 2022. Within this information, she analyzed splits along gender lines (male vs. female) and the three most commonly-represented races in the data pool (Black or African-American, white, and Asian).
Based on some preliminary searches that yielded interesting results, she looked at two key questions: who’s getting prescribed the most medications by volume, and who’s getting prescribed psychotropic/psychiatric medications most often? The first would indicate either over- or under-prescription (either extreme could mean inadequate or improper healthcare), and the second category of pharmaceuticals carries its own set of social, environmental factors. Mental health is still stigmatized and fraught, and access isn’t always equal across class and race lines. Psychiatric medications were also a specific topic of conversation among the healthcare workers Rouhana overheard during her volunteer shift.
When the data pull was complete, the variances in number of prescriptions and the frequency with which they were prescribed proved significant. In short: the hypotheses at the nurses’ station were correct.
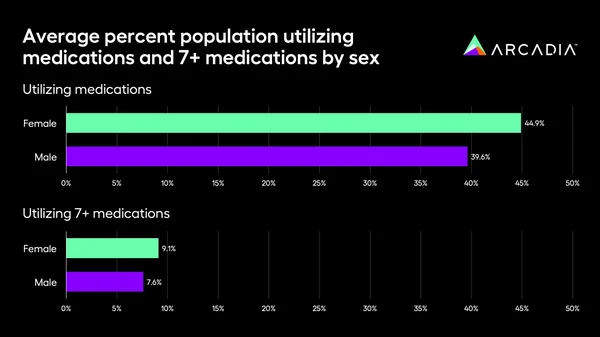
On average, 44.9% of women had at least one medication prescribed during this three-month period, while only 39.6% of men had a medication prescribed in this timeframe. Digging further, Rouhana and the Customer Insights team looked at the percentage of women and men prescribed at least seven distinct medications in the three-month period. 9.1% of women with a script had at least seven scripts, while 7.6% of men had seven or more medications.
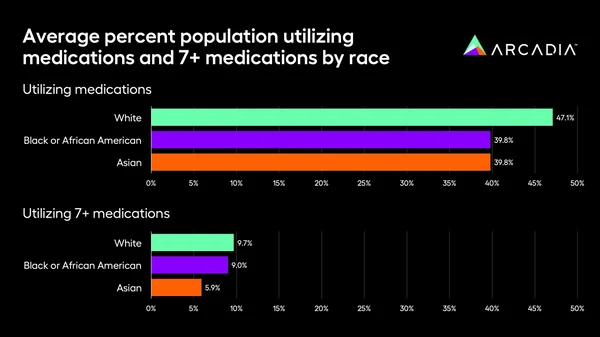
On average, 47.1% of white patients within this cohort were prescribed at least one medication during the three-month period, whereas only 39.8% of Asian and Black patients, respectively, had at least one script during that time. When that’s expanded to seven or more prescriptions, 9.7% of white patients had seven-plus scripts, while only 5.9% of Black and Asian members had at least seven meds.
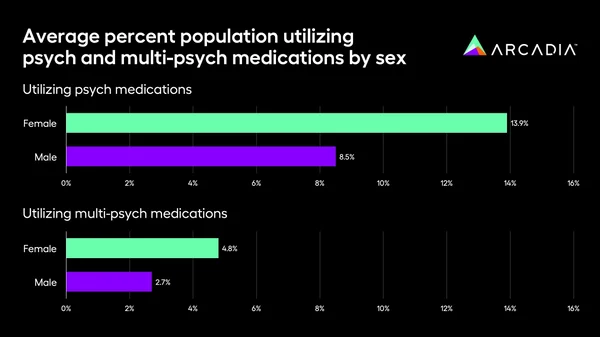
Psychotropic medications — which encompass treatments for conditions from mood disorders to depression by adjusting the brain’s chemistry — were similarly divisive along gender and race lines. 13.9% of women in this population were prescribed psychotropic drugs, compared to 8.5% of men. When that was narrowed to those prescribed more than one medication, 4.8% were women and 2.7% were men.
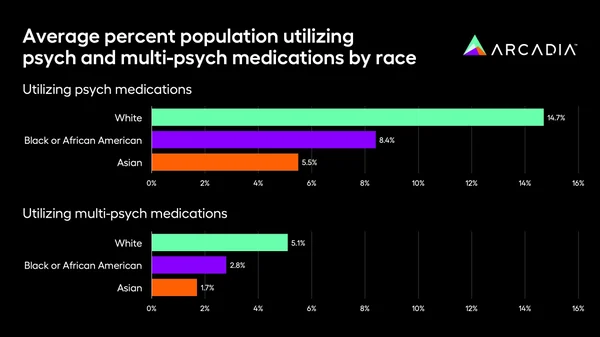
By race, white patients were prescribed psychotropic medication far more frequently (14.7% of white patients, versus only 5.5% of Asian patients, for example).
The reasons why these gaps might exist are numerous, but the data itself doesn’t give us the “why.” One potential factor might be utilization — women are traditionally more inclined to visit the doctor, for example, so maybe they’re receiving timely treatment for ailments that men ignore. Alternately, there’s the issue of stigma. In mental health, certain groups might be more inclined to seek care, or on the other end of the spectrum, underserved neighborhoods or populations might lack the necessary facilities to receive that care.
“I did some searching, and drug trials are done less on women,” Rouhana added. “So when they get a medication, they might not like it because hasn't been tested on their body, so then they're more likely to try different medications. That could be one thing. Maybe doctors are just more apt to prescribe for women, which is a bigger issue.”
“I don't think I'm really in a standpoint to say exactly where it's coming from,” she continued. “But those are some general ideas on what could be driving this.”
It’s dangerous to conflate correlation with causation, especially with issues as sensitive as health equity. While Rouhana can safely say the trends are statistically significant, the most important result for her team was implementing more dashboard-level detail for customers.
“It led us to add those controls for all of our member-level detailed dashboards,” Rouhana said. “So any one of our customers can use our pharmacy dashboards and filter by sex or race, and see how those trends are applicable in their population. They could also use it to filter and identify members that they may want to reach out to and talk about their pharmacy plan.”
These new member-level filters for sex- and race-related data are now available across the Vista dashboard library, including pharmacy, polypharmacy, prescription opioids, specialty drugs, and outpatient medical pharmacy.
This means that, if a healthcare organization wanted to minimize or investigate these discrepancies, they’d have one fewer hurdle in place, and the first step — identifying significant trends, potentially impacted patients, and doctors with specific prescribing patterns — would be at their fingertips.
If healthcare organizations are going to create meaningful change, they need a clear outline of the challenges ahead. Data analytics draw a sharp picture of everything from SDoH-based discrepancies to glaring risk gaps, and with this knowledge in-hand, medical providers and experts can charge confidently towards a more equitable future.
Ready to affect change? Let’s collaborate.